Home Forums Report Bugs Not plotting line and x-axis

Not plotting line and x-axis

Viewing 2 posts - 1 through 2 (of 2 total)
  • #43192

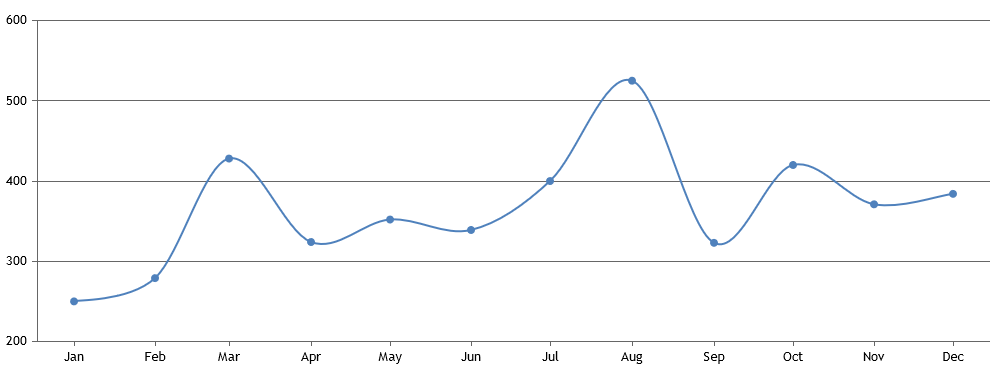
    Not plotting line and x-axis when i passed below option
    const options = {
    animationEnabled: true,
    axisX: {
    valueFormatString: “MMM”
    },
    data: [{
    xValueFormatString: “MMMM”,
    type: “spline”,
    dataPoints: [
    { x: new Date(2017, 0), y: 250 },
    { x: new Date(2017, 1), y: 279 },
    { x: new Date(2017, 2), y: 428 },
    { x: new Date(2017, 3), y: 324 },
    { x: new Date(2017, 4), y: 352 },
    { x: new Date(2017, 5), y: 339 },
    { x: new Date(2017, 6), y: 400 },
    { x: new Date(2017, 7), y: 525 },
    { x: new Date(2017, 8), y: 323 },
    { x: new Date(2017, 9), y: 420 },
    { x: new Date(2017, 10), y: 371 },
    { x: new Date(2017, 11), y: 384 }
    ]
    }]
    }

    #43213

    @abhik23,

    The chart-options that you have shared seems to be working fine, please take a look at this JSFiddle.
    JavaScript Spline Chart

    If you are still facing issue, kindly create JSFiddle (or sample project if it’s Angular/React/Vue) reproducing the issue you are facing and share it with us so that we can run it at our end to understand the scenario better and help you out.


    Vishwas R
    Team CanvasJS

Viewing 2 posts - 1 through 2 (of 2 total)

You must be logged in to reply to this topic.