Hi,
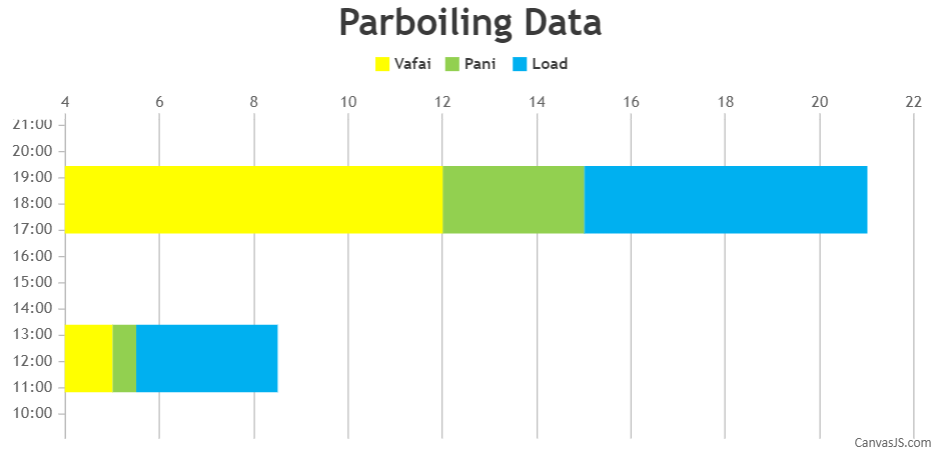
I am plotting a graph to check the daily delay timings of the machine. Half part is complete. But on the x -axis i want to show the time hours in 24 hour format. Unable to show that:
THis is the options array
var options = {
animationEnabled: true,
theme: “light2”,
title:{
text: “Parboiling Data”
},
axisY2:{
lineThickness: 0
},
toolTip:{
shared: true,
reversed: true
},
legend:{
verticalAlign: “top”,
horizontalAlign: “center”
},
data: [
{
type: “stackedBar”,
showInLegend: true,
name: “Vafai”,
axisYType: “secondary”,
color: “#FFFF00″,
dataPoints: [
{ y: 5, label:”2018-01-04”},
{ y: 12, label: “2018-01-05”}
]
},
{
type: “stackedBar”,
showInLegend: true,
name: “Pani”,
axisYType: “secondary”,
color: “#92D050”,
dataPoints: [
{ y: .5, label: “2018-01-04”},
{ y: 3, label: “2018-01-05” }
]
},
{
type: “stackedBar”,
showInLegend: true,
name: “Load”,
axisYType: “secondary”,
color: “#00B0F0”,
dataPoints: [
{ y: 3, label: “2018-01-04” },
{ y: 6, label: “2018-01-05” }
]
}
]
};
Please help me to solve this
.