Login to Ask a Question or Reply
You must be logged in to post your query.
Home › Forums › Chart Support › Multiseries Line Chart Mixture on Draw
Multiseries Line Chart Mixture on Draw
- This topic has 4 replies, 2 voices, and was last updated 3 years, 11 months ago by
Vishwas R.
Tagged: chart, Line, Multiseries
-
July 29, 2022 at 6:08 pm #38787
I am using CanvasJS in order to draw some charts from the data of IoT spread around.
These charts are multi-series line charts and data is composed by the server side. I am developing in MVC .NET core. I attach here below a JSFiddle demonstrating the issue.
JS Fiddle Multi Series Strange Lines
The thing is that indeed I build this chart object a bit differently in my application but the problem with the view is the same. By something like the below code.
 function createChart(incoming_data) {
        var lcl = JSON.parse(JSON.stringify(incoming_data));
        var titleText = eval('({' + lcl.title_dynamic + '})');

        var dataVals = eval(lcl.my_data);

        var chartCfg = {
            zoomEnabled: true,
            exportEnabled: true,
            animationEnabled: true,
            //height: 600,
            axisX: {
                title: "chart updates every 5 secs",
                labelFontSize: 12,
                titleFontSize: 20,
                crosshair: {
                    enabled: true,
                    snapToDataPoint: true
                },
                labelAngle: -40,
                labelFormatter: function (e) {
                    return CanvasJS.formatDate(e.value, "DD MMM HH:mm:ss");
                }
            },
            axisY: {
                crosshair: {
                    enabled: true,
                    snapToDataPoint: true,
                    valueFormatString: "#,##0"
                }
            },
            toolTip: {
                shared: false,
                contentFormatter: function (e) {
                    var content = " ";
                    for (var i = 0; i < e.entries.length; i++) {
                        content += CanvasJS.formatDate(e.entries[i].dataPoint.x, "DD/MM/YYYY HH:mm:ss") + "<br/>";
                        content += " " + e.entries[i].dataSeries.name + " : " + "<strong>" + e.entries[i].dataPoint.y + "</strong>";
                        content += "<br/>";
                    }
                    return content;
                }
            },
            legend: {
                //dockInsidePlotArea: true,
                cursor: "pointer",
                verticalAlign: "center",
                horizontalAlign : "left",  // "top" , "bottom"
                fontSize: 18,
                itemmouseover: function (e) {
                    e.dataSeries.lineThickness = e.chart.data[e.dataSeriesIndex].lineThickness * 3;
                    e.dataSeries.markerSize = e.chart.data[e.dataSeriesIndex].markerSize + 5;
                    e.chart.render();
                },
                itemmouseout: function (e) {
                    e.dataSeries.lineThickness = e.chart.data[e.dataSeriesIndex].lineThickness / 3;
                    e.dataSeries.markerSize = e.chart.data[e.dataSeriesIndex].markerSize - 5;
                    e.chart.render();
                },
                itemclick: function (e) {
                    if (typeof (e.dataSeries.visible) === "undefined" || e.dataSeries.visible) {
                        e.dataSeries.visible = false;
                    } else {
                        e.dataSeries.visible = true;
                    }

                    e.chart.render();
                }
            }
        };

        chart = new CanvasJS.Chart("chart-container", chartCfg);

        chart.options.title = titleText;
        chart.options.data = dataVals;
Another strange thing is sometimes if I draw with a different dataset even with a larger one, that doesn’t happen.
PS. Mostly the data points I got from the server side are ~1.5million.
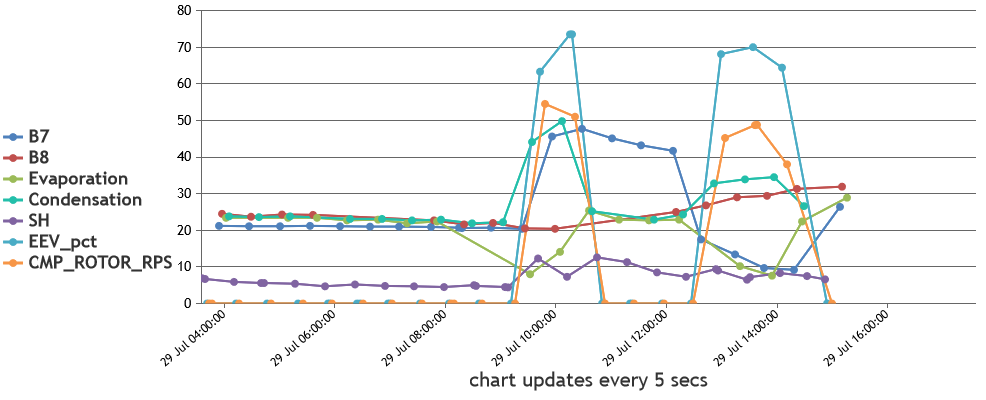
Any idea what can be the reason for this? Is it maybe because some points are the samedatetimeand different values?August 1, 2022 at 12:02 pm #38800Data in the chart seems to move back & froth as CanvasJS renders chart with the data in the order you pass in the options without sorting. Passing data in ascending order of x-values or sorting it based on x-values before rendering the chart seems to work fine in this case. Please find the code-snippet for sorting datapoints in ascending order of x-values below.
for(var i = 0; i < chart.options.data.length; i++) {
	chart.options.data[i].dataPoints.sort(compareDataPointXAscend);
}

function compareDataPointXAscend(dataPoint1, dataPoint2) {
	return dataPoint1.x - dataPoint2.x;
}
Please take a look at this updated JSFiddle for complete code.
—
Vishwas R
Team CanvasJSAugust 2, 2022 at 3:46 pm #38813Helpful team, appreciate it. Resorting a huge number of data points could slower the performance in my case. Therefore, I’ll first order in the backend.
Thanks a lot for the feedback.
August 2, 2022 at 4:33 pm #38815There’s another question I have during chart creation. I am building my
chart.options.datain the backend since the client can select x number of different data types and a time range. So, I use the code piece below to populate the CanvasJS chart data.string jsCanvasData = string.Empty; foreach (var packetsInName in chart_data_list.GroupBy(x => x.data_name)) { List<DataPoint> dataPoints2 = new List<DataPoint>(); packetsInName.ToList().ForEach(a => dataPoints2.Add( new DataPoint( ((DateTimeOffset)a.inserted_date_time).ToUnixTimeSeconds() * 1000 , a.data_value))); //A buffer to the end of the chart to see it better dataPoints2.Add(new DataPoint(((DateTimeOffset)end_data_date_time.AddHours(2)).ToUnixTimeSeconds() * 1000, null)); jsCanvasData += "{type: \"line\",\r\n" + "highlightEnabled: true," + "markerType:\"circle\"," + "xValueType:\"dateTime\"," + "xValueFormatString:\"DD MMMMM YYYY HH:mm:ss\"," + "name:'" + packetsInName.Key + "'," + "showInLegend: true," + "dataPoints:" + JsonConvert.SerializeObject(dataPoints2) + "},"; }Is there a better way you could suggest?
August 8, 2022 at 6:11 pm #38870I would suggest you to generate datapoints in the back-end and keep all other chart-options in the front-end itself. Please take a look at this gallery page for an example on rendering chart with data from database.
If you are unable to achieve it or if you encounter any issue while achieving the same, kindly create sample project with sample data & share it with us over Google-Drive or Onedrive so that we can run it locally at our end to understand the scenario better and help you out.
—
Vishwas R
Team CanvasJS
Tagged: chart, Line, Multiseries
You must be logged in to reply to this topic.