@fbahashwan,
To display the chart using set of year data on loop, you need to first create an array object as shown in below code snippet.
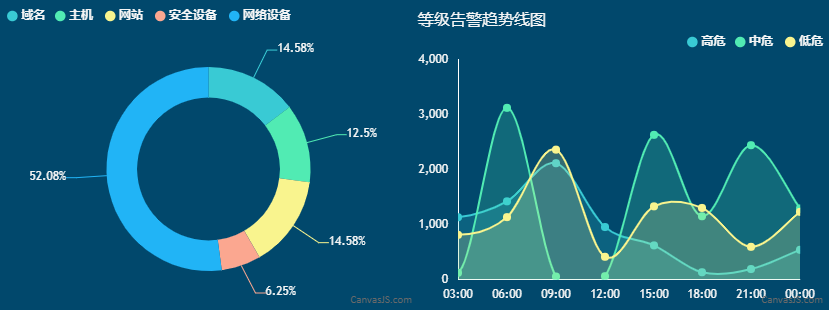
var data = [{
    "doughnut": [
      { label: "域名", y: 13 },
      { label: "主机", y: 13 },
      { label: "网站", y: 10 },
      { label: "安全设备", y: 6 },
      { label: "网络设备", y: 60 },
    ],
    "splineArea": [
      [
        { label: "00:00", y: 2000},
        { label: "03:00", y: 122},
        { label: "06:00", y: 3121},
        { label: "09:00", y: 54},
        { label: "12:00", y: 60},
        { label: "15:00", y: 2630},
        { label: "18:00", y: 1150},
        { label: "21:00", y: 2442},
        { label: "00:00", y: 1292}
      ],
      [
        { label: "00:00", y: 1130},
        { label: "03:00", y: 812},
        { label: "06:00", y: 1134},
        { label: "09:00", y: 2361},
        { label: "12:00", y: 413},
        { label: "15:00", y: 1330},
        { label: "18:00", y: 1301},
        { label: "21:00", y: 594},
        { label: "00:00", y: 1230}
      ],
      [
        { label: "00:00", y: 1220},
        { label: "03:00", y: 1132},
        { label: "06:00", y: 1421},
        { label: "09:00", y: 2114},
        { label: "12:00", y: 954},
        { label: "15:00", y: 620},
        { label: "18:00", y: 132},
        { label: "21:00", y: 190},
        { label: "00:00", y: 540}
      ]
    ]
  },
  .
  .
}]
You can update the chart data every 2 seconds by looping through above created array object and updating chart options. Please take a look at below code snippet for the same.
var i = 0;
function updateChart() {
    chart.options.data[0].dataPoints = jsonData[i].splineArea[0];
    chart.options.data[1].dataPoints = jsonData[i].splineArea[1];
    chart.options.data[2].dataPoints = jsonData[i].splineArea[2];
    chart1.options.data[0].dataPoints = jsonData[i].doughnut;
    chart.render();
    chart1.render();
    i = (i+1) % jsonData.length;
    setTimeout(updateChart, 2000);
}
Also, check out this JSFiddle for complete working code.
—-
Manoj Mohan
Team CanvasJS
.
