Home Forums Report Bugs multiple chart axisY zooming problem

multiple chart axisY zooming problem

Viewing 4 posts - 1 through 4 (of 4 total)
  • #42398

    Hello
    I have a problem with multi charts on Stockchart
    the problem appears when there is a second chart over Stckchart, as you can see in this jsfiddle when I zoom-in on the right side it has no problem and candles are readable, but If I zoom in on the left side vertical zooming (axisY minimum: And maximum) does not adjust the view even though the second line is not visible on the chart and candles are unreadable.

    #42409

    @ali136m,

    The range of an axis depends on multiple factors like dataseries attached to it, the datapoint values of all the dataseries visible in the viewport, etc. In your case, the issue might be happening due to datapoint values in line series. Removing the line series seems to be working fine as shown in this updated JSFiddle.

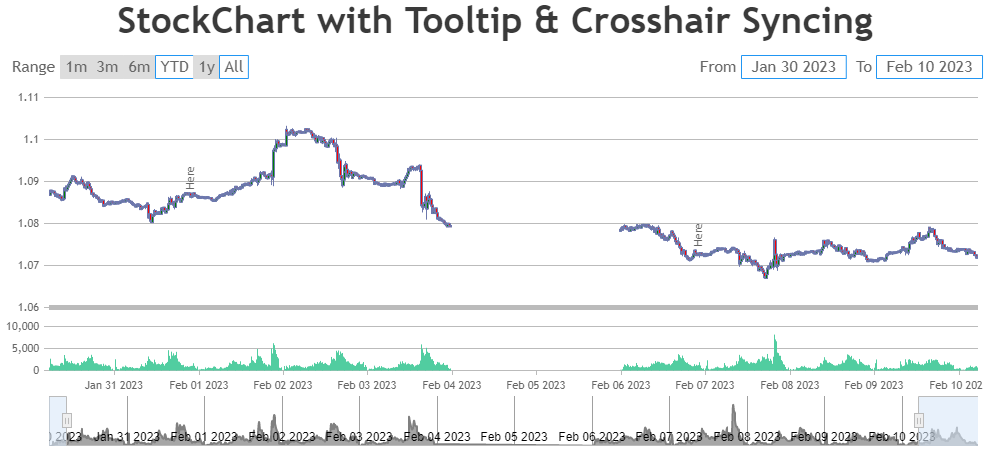
    CanvasJS StockChart with Multiple Chart

    —-
    Manoj Mohan
    Team CanvasJS

    #42420

    Thank you,

    Yes you are right, without any other charts it works just fine, but I simplified my chart to show you the problem.
    Codes are generated in another python program to analyze the chart and there will be lots of ‘lines, rectangles, circles, ETC.’ over it.
    I need to know if there is any way to overcome this problem or if there is any other way to draw ‘lines, rectangles, circles, Text, ETC. just like indicators’ over my chart without facing this problem.

    Thanks.

    • This reply was modified 11 months, 4 weeks ago by ali136.
    #42429

    @ali136m,

    To overcome the issue you are facing, you can hide the dataseries which are outside of the viewport range by setting visible property to ‘false’ in rangeChanging event handler. Please take a look at the code snippet below for the same.

    
    rangeChanging: function(e) {
      if(e.stockChart.charts[0].data.length > 1) {
        var chart = e.stockChart.charts[0];
        for(i=1; i<chart.data.length; i++) {
          if(chart.options.data[i].minMaxXValue[0] > e.maximum || chart.options.data[i].minMaxXValue[1] < e.minimum)
            chart.data[i].get('visible') && chart.data[i].set('visible', false, false);
          else
            !chart.data[i].get('visible') && chart.data[i].set('visible', true, false);
        }
      }
    }

    Also, check out this updated JSFiddle for complete working code.

    —-
    Manoj Mohan
    Team CanvasJS
Viewing 4 posts - 1 through 4 (of 4 total)

You must be logged in to reply to this topic.