Home Forums StockChart Support Modifying the slider

Modifying the slider

Viewing 3 posts - 1 through 3 (of 3 total)
  • #36262

    Hi,
    here is the graph I have : https://jsfiddle.net/yocqp7dr/5/
    Each Y value is written twice on the graph : once right above the chart itself (which is what I want), and once in the slider.
    I’d like to be able to do 2 things : apply a function to the value displayed in the slider and also completely get rid of the second label.
    any idea on how to achieve this ?
    thanks

    #36275

    @ben551445,

    Since you are using the same dataPoints array on both the chart’s dataSeries and navigator’s dataSeries, any changes made to this array will be reflected on both the dataSeries. In order to remove the indexLabel from the navigator, you can clone an array of the dataPoints for the navigator’s dataSeries using jquery.extend() as shown in the code-snippet below,

    navigator: {
        height: 50,
        data:[{
          dataPoints: cloneDPS(dps),
       }],
    },
    
    function cloneDPS(dps) {
    	var tempDPS = [];
    	for(var i = 0; i < dps.length; i++) {
      	tempDPS.push($.extend(true, {}, dps[i]));
      }
      return tempDPS;
    }

    Kindly take a look at this updated JSFiddle for an example on the same.
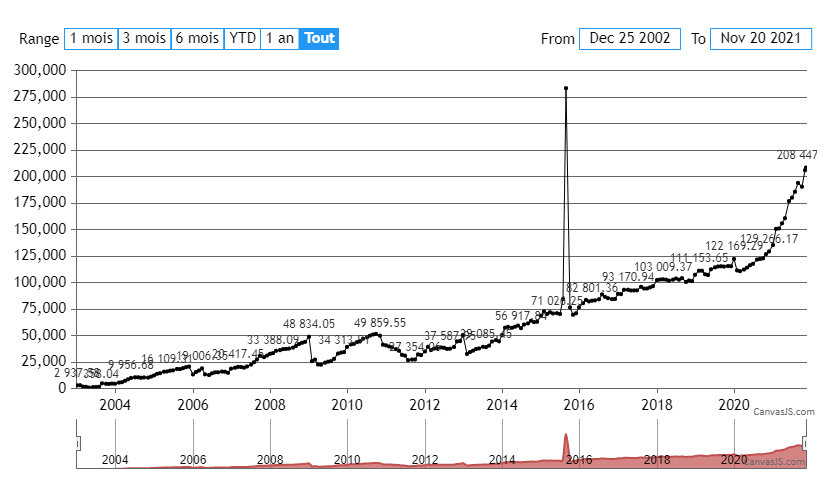
    stockChart with indexLabels


    Adithya Menon
    Team CanvasJS

    #36280

    just what I needed.
    thanks for the support :)

Viewing 3 posts - 1 through 3 (of 3 total)

You must be logged in to reply to this topic.