Login to Ask a Question or Reply
You must be logged in to post your query.
Home › Forums › Chart Support › Marker space issue
Marker space issue
- This topic has 7 replies, 2 voices, and was last updated 4 years, 8 months ago by
Elanchezhiyan.
Tagged: markers, x-axis minimum value
-
October 26, 2021 at 5:23 pm #36134
Hi team,
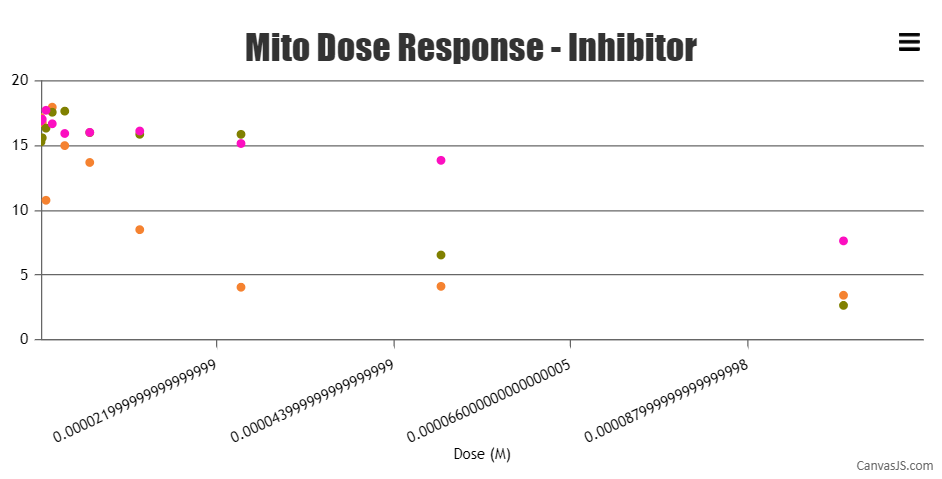
We have a issue in marker between the values, which are in logbase10 form. Attached the image for your info. The value between 10^-6 and 10^-7.JS fiddle Link: https://jsfiddle.net/ElanchezhiyanP/tzsw509o/6/
October 27, 2021 at 9:52 am #36137Also if I remove maximum and minimum value, still i face the space issue.
JS fiddle link: https://jsfiddle.net/ElanchezhiyanP/tzsw509o/13/
October 27, 2021 at 8:53 pm #36147Are you referring to the distance between the axis labels? The axis labels in case of logarithmic axis is not equidistant as in regular axis – this is the default behavior of logarithmic axis.
If you are referring to markers, can you kindly brief us more on the same, so that we can understand the scenario better and help you out?
—
Ranjitha R
Team CanvasJSOctober 28, 2021 at 10:51 am #36151Yes, Exactly I’m referring the distance between the X-Axis label. In case of logarithmic, we will have an equal space distance. Am I correct?. The distance between the first and second x-axis & second and third x-axis differs. I would like to know the reason for it.
October 29, 2021 at 7:40 am #36153Hi @ranjitha-r,,
We have an issue with the minimum x-axis value where the values will be like 0.00000017578124999999998. We have given the x-axis minimum and maximum value with the interval also. But the question here is why the minimum values are not shown in the graph i.e. x-axis? May I know the exact reason for this issue? Attached the JS Fiddle link for your reference.Also, I would like to know if you have any round function for the values? if Yes, let me know how to get rid of them.
Image link: https://prnt.sc/1xll0t4
JS Fiddle link: https://jsfiddle.net/ElanchezhiyanP/tzsw509o/37/November 2, 2021 at 5:13 pm #36186Yes, Exactly I’m referring the distance between the X-Axis label. In case of logarithmic, we will have an equal space distance. Am I correct?. The distance between the first and second x-axis & second and third x-axis differs. I would like to know the reason for it.
In logarithmic axis, the interval doesn’t increase in equal increments, instead, each interval is increased by a factor of the base of the logarithm. Hence, the axis labels are placed at irregular intervals.
We have an issue with the minimum x-axis value where the values will be like 0.00000017578124999999998. We have given the x-axis minimum and maximum value with the interval also. But the question here is why the minimum values are not shown in the graph i.e. x-axis?
Sorry, controlling the first label on the axes is not available as of now. minimum property only sets the starting range of the axis and not the first label on axis.
Also, I would like to know if you have any round function for the values? if Yes, let me know how to get rid of them.
Axis labels are not shown for dataPoint but at every interval of the axis. Hence, the labels might not show the exact value as that of the dataPoint. But if you would like to add more decimal places to the labels you can do so by using the following
valueFormatString: "0.#####################"for x-axis. Please check this documentation page for more information on valueFormatString and the available formats.Also, kindly check this updated JSFiddle for a working example.
—
Ranjitha R
Team CanvasJSNovember 2, 2021 at 7:53 pm #36195@ranjitha-r,
Thanks for the help.
Tagged: markers, x-axis minimum value
You must be logged in to reply to this topic.