@ezsolve,
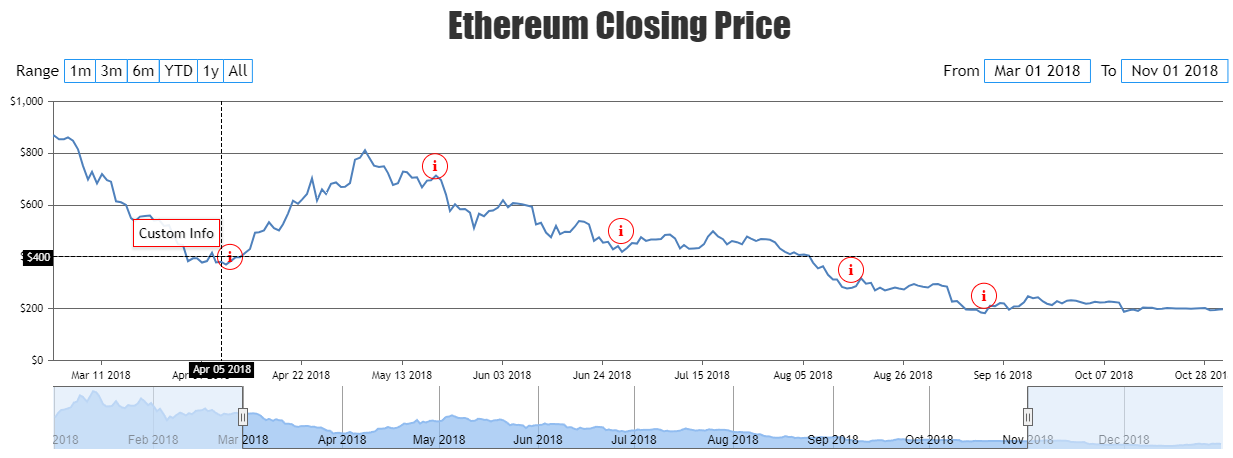
You can check if tooltip is shown for overlapped datapoint using updated event of toolTip and show the tooltip for scatter series when it overlaps with the help of showAtX method. Please take a look at the code snippet below for the same.
toolTip: {
  updated: function(e) {
    var dp = false;
    // skip the check if tooltip is shown for scatter series
    if(e.entries.length == 1 && e.entries[0].dataSeriesIndex == 0 ) {
      dp = overlappedScatterSeriesDatapoint(e.entries[0].dataPoint, e.entries[0].dataPointIndex);
      if(dp) {
        stockChart.charts[0].toolTip.showAtX(dp.x, 1);
      }
    }
  }
}
.
.
function overlappedScatterSeriesDatapoint(dataPoint, index) {
  var radius = stockChart.charts[0].data[1].get("markerSize") / 2;
  var currentX = stockChart.charts[0].axisX[0].convertValueToPixel(dataPoint.x);
  var currentY = stockChart.charts[0].axisY[0].convertValueToPixel(dataPoint.y);

  for (var i=0; i<stockChart.charts[0].data[1].dataPoints.length; i++) {
    var dpX = stockChart.charts[0].axisX[0].convertValueToPixel(stockChart.charts[0].data[1].dataPoints[i].x)
    var dpY = stockChart.charts[0].axisY[0].convertValueToPixel(stockChart.charts[0].data[1].dataPoints[i].y)
    var distance = Math.sqrt((currentX - dpX) * (currentX - dpX) + (currentY - dpY) * (currentY - dpY));

    // Check if tooltip is shown for datapoints overlapped with scatter data series
    if(distance <= radius) {
      return stockChart.charts[0].data[1].dataPoints[i]
    }
  }

  return false;
}
Also, check out this JSFiddle for complete working code.

—-
Manoj Mohan
Team CanvasJS
