Login to Ask a Question or Reply
You must be logged in to post your query.
Home › Forums › Chart Support › Marker image on multiple datapoints with multiple lines
Marker image on multiple datapoints with multiple lines
- This topic has 12 replies, 2 voices, and was last updated 4 years, 5 months ago by
Elanchezhiyan.
Tagged: Custom marker image
-
January 24, 2022 at 4:55 pm #36731
Hi Team,
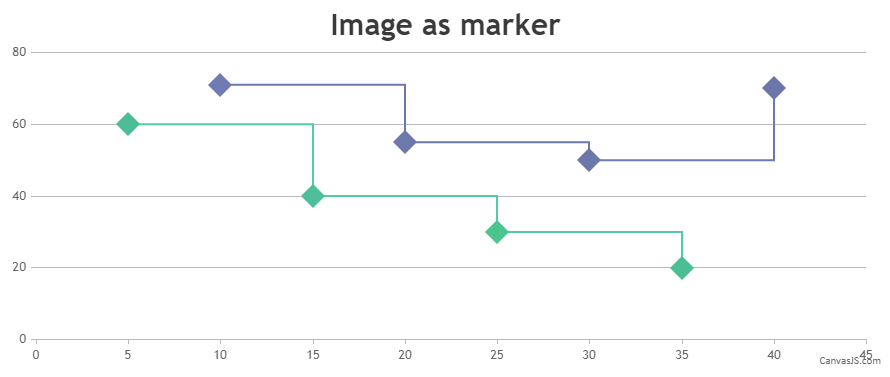
We are using line chart for plotting with our datapoints. We tried to use custom markers as diamond shape is not available to use in datapoints as like circle/triangle (If available, please let us know). While using custom markers, we are not able to point more than one line. Attached JSFiddle link for your reference.January 25, 2022 at 6:52 pm #36752In case of multi-series chart, you can loop through dataseries and pass dataseries index as well to position the image over the chart. Please find the code-snippet below.
function addMarkerImages(chart) {
  for(var i = 0; i < chart.data.length; i++) {
    customMarkers[i] = [];
    for (var j = 0; j < chart.data[i].dataPoints.length; j++) {
      customMarkers[i].push($("<img>").attr("src", chart.data[i].dataPoints[j].markerImageUrl)
                            .css("display", "none")
                            .css("height", 30)
                            .css("width", 30)
                            .appendTo($("#chartContainer>.canvasjs-chart-container"))
                           );
      positionMarkerImage(customMarkers[i][j], i, j);
    }
  }
}
Also, check out this JSFiddle for complete working sample.

—-
Ranjitha R
Team CanvasJSJanuary 27, 2022 at 8:27 pm #36784@ranjitha-r,
Thanks for the info. It works fine.January 28, 2022 at 6:02 pm #36791@Ranjitha-R,
How do I hide the custom image when we try to zoom the graph? It is getting populated out of the graph, which looks awkward. Attached image for your reference.January 31, 2022 at 2:40 pm #36805Please use this image: Custom images to hide when zooming in
February 1, 2022 at 6:59 pm #36852You can position the image relative to viewport of the chart using rangeChanged event that would trigger whenever the chart range is changed by zooming/panning. Please find the code-snippet below.
 if(chart.data[dsIndex].dataPoints[dpIndex].x > chart.axisX[0].viewportMinimum && chart.data[dsIndex].dataPoints[dpIndex].x < chart.axisX[0].viewportMaximum) {
    customMarker.css({display: "block"})
  }
  else {
    customMarker.css({display: "none"})
  }
Also, take a look at this JSFiddle for complete working sample.
—-
Ranjitha R
Team CanvasJSFebruary 1, 2022 at 7:16 pm #36853@Ranjitha-R,
Thanks and it works fine.February 14, 2022 at 5:57 pm #36930In the previous post, we have used image with URL. If the SVG image is used, how do i fill the color based on the line color which is given dynamically? Attached image for your reference.
Image: SVG Image URL to fill color
February 16, 2022 at 6:46 pm #36956Changing the color of SVG image can be done by applying filter property. You can use hexToCSSFilter package to do so. You can set the color of the SVG images to the color of particular dataseries as shown in the code snippet below.
for (var j = 0; j < chart.data[i].dataPoints.length; j++) {
      customMarkers[i].push($("<img>").attr("src", chart.data[i].dataPoints[j].markerImageUrl)
                            .css("display", "none")
                            .css("height", 5)
                            .css("width", 5)
                            .css("filter", hexToCSSFilter(chart.data[i].color))
                            .appendTo($("#chartContainer>.canvasjs-chart-container"))
                           );
      positionMarkerImage(customMarkers[i][j], i, j);
    }
Also, check out this JSFiddle for working sample.
Ranjitha R
Team CanvasJSFebruary 18, 2022 at 6:00 pm #36969Hi @Ranjitha-R,
We have tried to use the above example in our code. But we get an error that Uncaught ReferenceError: hexToCSSFilter is not defined. Can you send us the function which you have used in the fiddle? Attached image for your reference.
February 18, 2022 at 6:15 pm #36987Based on the image shared by you, it seems like you have not added the hexToCSSFilter package in your code. Adding hex-to-css-filter.js package should work fine in your case.
—
Ranjitha R
Team CanvasJSFebruary 21, 2022 at 5:01 pm #36997Thanks @Ranjitha-R
Tagged: Custom marker image
You must be logged in to reply to this topic.