Home Forums Chart Support Line chart – Whisker length – Logarithmic format

Line chart – Whisker length – Logarithmic format

Viewing 3 posts - 1 through 3 (of 3 total)
  • #37961

    Hi Team,

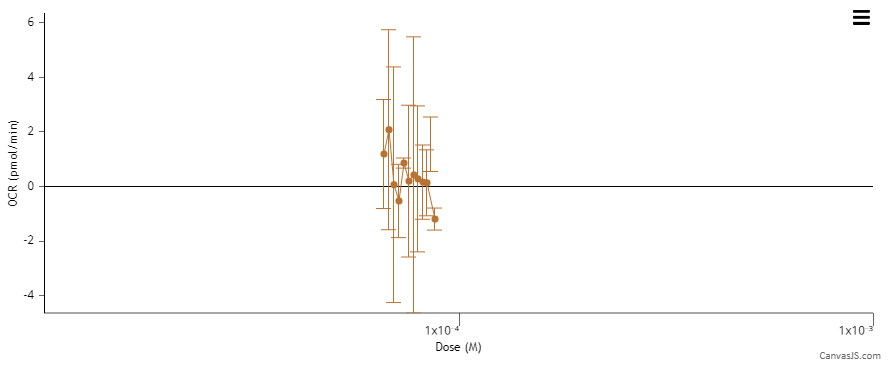
    When the datapoints are plotted in the logarithmic values, the whisker length is getting too small. When we zoom, it can be viewed. We have custom function for converting and showing the exponential values in chart. Attached the JSFiddle for your reference.

    JSFiddle Link: https://jsfiddle.net/ElanchezhiyanP/3tfLzv7o/27/

    #37972

    @elanchezhiyan,

    Whisker length depends on multiple factors like dataPointWidth, dataPointMaxWidth, axis range, etc. In your case, the whisker length gets limited because you are setting x-axis range(I noticed you are setting axisX minimum and maximum). Removing these properties should work fine.

    However, if you would like to override this behavior, you can set whiskerLength as well as increase the default dataPointWidth.

    Please check this JSFiddle for a working example.

    Error chart with whisker length


    Thangaraj Raman
    Team CanvasJS

    #37973

    @Thangaraj Raman,

    Thanks for the info. I will check and let you know.

Viewing 3 posts - 1 through 3 (of 3 total)

You must be logged in to reply to this topic.