You must be logged in to post your query.
Home › Forums › StockChart Support › limit the number of indexLabel displayed
Hi, I created a stockchart based on this one : https://canvasjs.com/docs/stockcharts/basics-of-creating-html5-stockchart/
I added many datapoints and I want to display some of the y values on the graph, so I added “indexLabel: “{y}”,”. As I have too many points, the result is unreadable. Is there a method to automatically limit the number of labels displayed so that it remains readable ? how would you deal with this ? thanks
https://jsfiddle.net/ben551445/txn95L1s/13/
@ben551445,
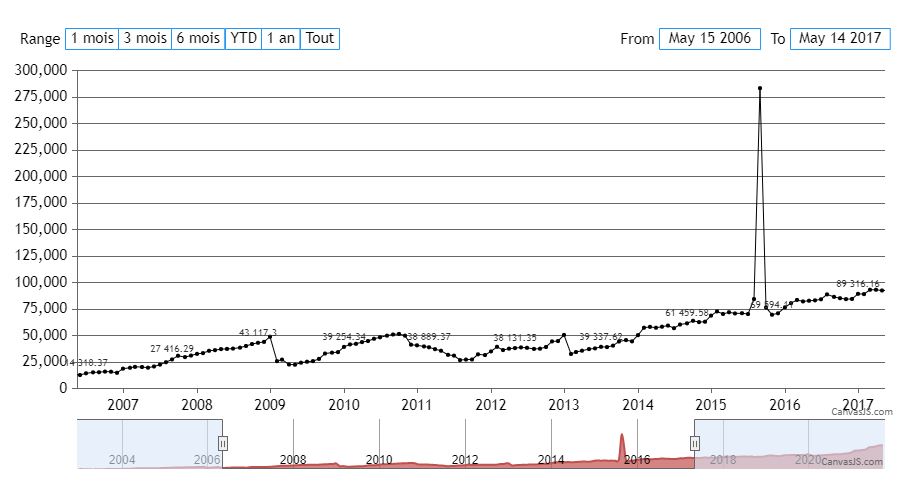
It’s possible to show indexlabels for selected datapoints based on number of datapoints present within the viewport of chart. You can also update them upon zooming / panning with the help of rangedChanged event. Please refer to the code-snippet below,
function setIndexLabels(e) { var noOfDataPoints = 0; var stockChart = e.stockChart ? e.stockChart : e; for(var i = 0; i < stockChart.charts[0].data[0].dataPoints.length; i++) { if(stockChart.charts[0].data[0].dataPoints[i].x > stockChart.charts[0].axisX[0].viewportMinimum && stockChart.charts[0].data[0].dataPoints[i].x < stockChart.charts[0].axisX[0].viewportMaximum) noOfDataPoints++; } if(noOfDataPoints<15) { stockChart.options.charts[0].data[0].indexLabel = "{y}"; } else { stockChart.options.charts[0].data[0].indexLabel = null; for(var i = 0; i < dps.length; i++) { stockChart.options.charts[0].data[0].dataPoints[i].indexLabel = null; } for(var i = 0; i < dps.length; i) { stockChart.options.charts[0].data[0].dataPoints[i].indexLabel = "{y}"; i = i+Math.ceil(noOfDataPoints/10); } } if(stockChart != e) { stockChart.options.rangeSelector.selectedRangeButtonIndex = e.index; } stockChart.render(); }
Kindly take a look at this updated JSFiddle for complete code on the same.
— Adithya Menon Team CanvasJS
awesome !!
just one thing :)
would you be able to make sure that the last point (on the right) gets its value displayed instead of the first one ?
It is possible to display the indexLabel on the last dataPoint by finding the index of the last dataPoint in the current viewport Range as shown in this code-snippet below,
for(var i = 0; i < stockChart.charts[0].data[0].dataPoints.length; i++) { if(stockChart.charts[0].data[0].dataPoints[i].x > stockChart.charts[0].axisX[0].viewportMinimum && stockChart.charts[0].data[0].dataPoints[i].x < stockChart.charts[0].axisX[0].viewportMaximum) { lastDataPointIndex = i; noOfDataPoints++; } }
Kindly take a look at this updated JSFiddle for an example on the same.
You must be logged in to reply to this topic. Login/Register