Login to Ask a Question or Reply
You must be logged in to post your query.
Home › Forums › Chart Support › Legend in Pie Graph Padding (updates?)
Legend in Pie Graph Padding (updates?)
- This topic has 9 replies, 2 voices, and was last updated 4 years, 8 months ago by
Manoj Mohan.
-
May 12, 2021 at 2:28 pm #34307
Hi CanvasJs team!
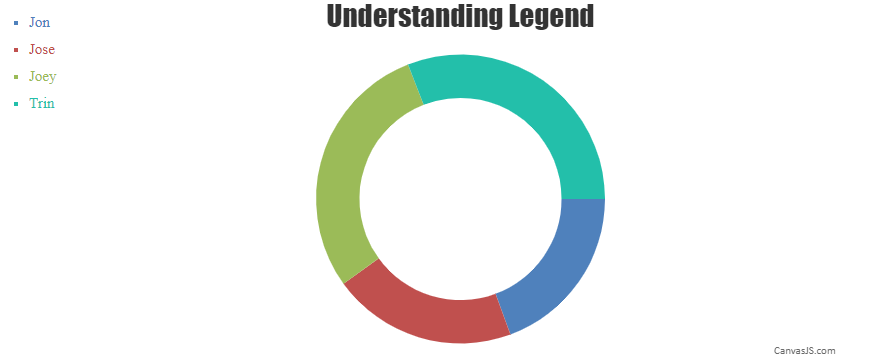
Is padding in legend available already? I read similar questions of mine but the solution they provided is not suitable for my project which is the markerMargin. My current legend alignment is
verticalAlign: "center", horizontalAlign:“right”,So this is what it looks like,

I just want to add padding at bottom of every legend so that is it presentable.
Any workarounds will be appreciated. Thanks a lot CanvasJs team 😀😀😀
May 12, 2021 at 2:47 pm #34312May 13, 2021 at 7:51 am #34323Please help team
May 13, 2021 at 3:46 pm #34327Any support guys? A simple No would suffice. Thanks. I’m not giving up till someone told me its impossible because I read the forums and it was back 5 years ago and I hope there is a workaround that it is not written in documentation.
May 13, 2021 at 8:47 pm #34333You can add spacing between legend marker and legend text using markerMargin, but adding spacing between legends is not possible as of now. However, you can create custom legends using DOM element and use css property to add padding between legends as shown in this updated JSFiddle.

—-
Manoj Mohan
Team CanvasJSMay 14, 2021 at 7:45 am #34336Hi Manoj! Thanks for reaching out. Your solution is nice and working as expected, however I am using Angular and I’m not using jquery and document.getElementById. Would you mind sharing it with Angular code snippet?
Thanks again Manoj! 😀😀😀
-
This reply was modified 4 years, 8 months ago by
boogeyman.
May 14, 2021 at 8:20 pm #34345The logic mentioned in the above shared example seems to be working fine even in Angular. In angular, you can create an array of legend items and loop it using ngFor in the app.component.html file to display legend items as shown in the code snippet below.
app.component.html
<div class="container">
  <div id="legends" class="col col-2">
    <ul id="legendList">
      <li *ngFor="let legend of legendList" [style.color]=legend.color>{{legend.text}}</li>
    </ul>
  </div>
  <div id="chartContainer" class="col col-10" style="height: 360px;"></div>
</div>
app.component.ts
.
.
customLegends(chart: any) {
    var colorSetArray = chart.get('selectedColorSet');
    for (var i = 0; i < chart.options.data[0].dataPoints.length; i++) {
      var dp = chart.options.data[0].dataPoints[i];
      this.legendList.push({
        text: dp.name,
        color: colorSetArray[i % colorSetArray.length]
      });
    }
}
.
.
Also, check out this Stackblitz example for complete working code.
—-
Manoj Mohan
Team CanvasJSMay 15, 2021 at 8:04 am #34346Alright Thanks Manoj. Sorry for disturbing you and you really provided me a stackblitz code. Thanks friend
May 21, 2021 at 12:15 pm #34385Hi @manoj-mohan! Is it even possible to retain the original legend design without providing the
- bullets? I think that is more presentable. Thanks Manoj! Please let me know if it is possible.
May 22, 2021 at 11:39 am #34404You can use list-style-type property of css to customize the bullets as per your requirement. Please take a look at this MDN documentation for more details.
—-
Manoj Mohan
Team CanvasJS -
This reply was modified 4 years, 8 months ago by
You must be logged in to reply to this topic.