trying to get a canvas graph using csv file.
The name of the csv is “Data.csv”
The contents of the csv file:
11/06/2014,5992
12/06/2014,6341
13/06/2014,6653
When I run it I get a blank screen.
Am I missing something.
<!DOCTYPE html>
<html>
<head>
<title>Chart using XML Data</title>
<script type="text/javascript" src="https://canvasjs.com/assets/script/jquery-1.11.1.min.js"></script>
<script type="text/javascript" src="https://cdn.canvasjs.com/canvasjs.min.js"></script>
<script type="text/javascript">
window.onload = function() {
var dataPoints = [];
function getDataPointsFromCSV(Data.csv) {
var dataPoints = csvLines = points = [];
csvLines = csv.split(/[\r?\n|\r|\n]+/);
for (var i = 0; i < csvLines.length; i++)
if (csvLines[i].length > 0) {
points = csvLines[i].split(",");
dataPoints.push({
x: parseFloat(points[0]),
y: parseFloat(points[1])
});
}
return dataPoints;
}
$.get("https://canvasjs.com/services/data/datapoints.php?xstart=5&ystart=10&length=10&type=csv", function(data) {
var chart = new CanvasJS.Chart("chartContainer", {
title: {
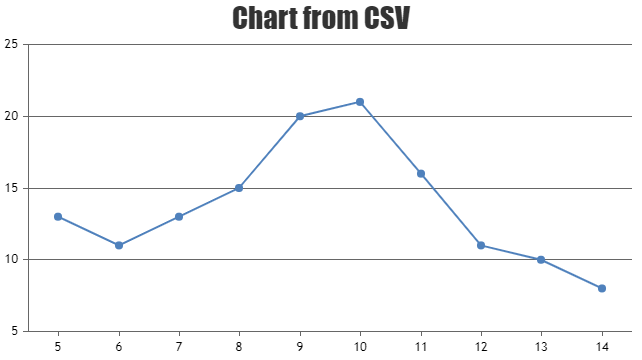
text: "Chart from CSV",
},
data: [{
type: "line",
dataPoints: getDataPointsFromCSV(data)
}]
});
chart.render();
});
}
</script>
</head>
<body>
<div id="chartContainer" style="width:100%; height:300px;"></div>
</body>
</html>
.