@elimuio,
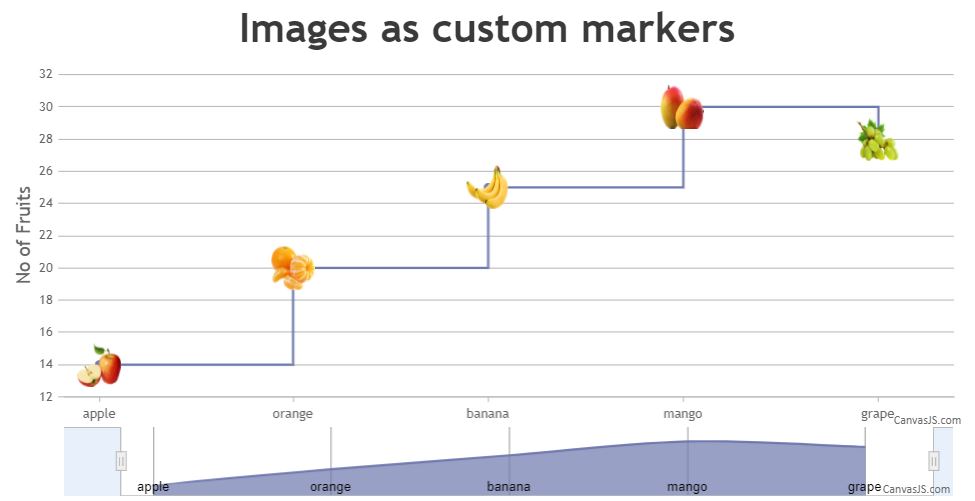
You can position images on the StockChart by creating an array of images and then setting the CSS properties (top, left, display) of those images to the same position of the markers in a stepLine chart as shown in the code-snippet below,
function addImages(chart){
  for(var i = 0; i < stockChart.charts[0].data[0].dataPoints.length; i++){
    var label = stockChart.charts[0].data[0].dataPoints[i].label;

    if(label){
      fruits.push( $("<img>").attr("src", images[i].url)
                  .attr("class", label)
                  .css("display", "none")
                  .appendTo($("#chartContainer>.canvasjs-stock-container>.canvasjs-chart-panel"))
                 );
    }
    positionImage(fruits[i], i);
  }
}
Also, kindly take a look at this JSFiddle for an example with complete code to position images on the StockChart.
You can also take a look at this documentation page for a step-by-step tutorial on how to position images over a chart.
—
Adithya Menon
Team CanvasJS
.