@keval-panchal,
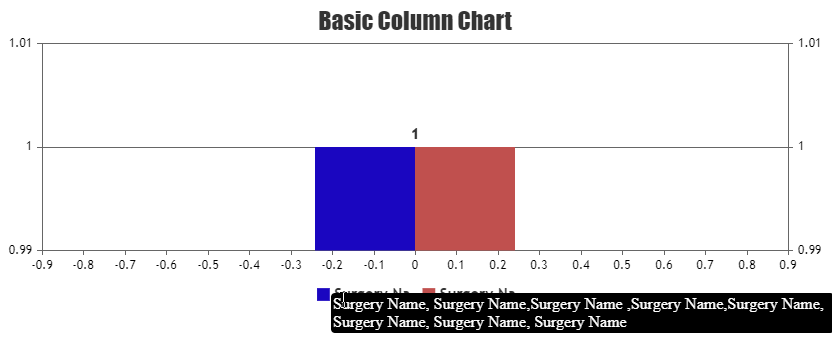
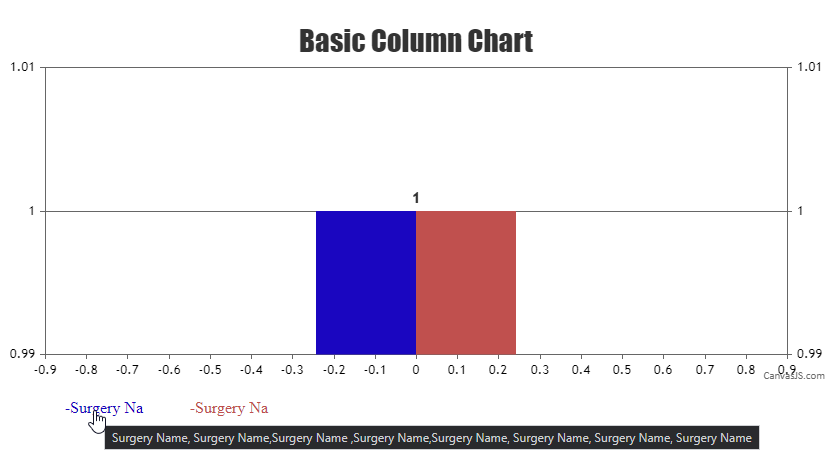
Sorry, it is not possible to show tooltip for axis label as of now. However you can show tooltip for legend with the help of itemmouseover and itemmouseout event of legends as shown in this code snippet.
.
.
.
legend: {
    cursor:"pointer",
    fontSize: 15,
    itemmouseover: function(e){
      showLegendToolTip(e.x, e.y, e.dataSeries.legendLongText);
    },
    itemmouseout: function(e) {
      hideLegendToolTip();
    }
}
.
.
.
for(var i=0; i<chart.options.data.length; i++) {
  chart.options.data[i].legendLongText = chart.options.data[i].legendText;
  chart.options.data[i].legendText = chart.options.data[i].legendLongText.slice(0, 10);
}

chart.render();
jQuery("#chartContainer").append("<div class='custom-legend-tooltip'></div>");
var customToolTipLegend = jQuery(".custom-legend-tooltip");

jQuery(".custom-legend-tooltip").on("mouseout", hideLegendToolTip);

function showLegendToolTip(x, y, text) {
  customToolTipLegend.text(text);
  customToolTipLegend.css({left: x, top: y})
  customToolTipLegend.removeClass("hide");
}

function hideLegendToolTip() {
  customToolTipLegend.addClass("hide");
}
Please take a look at this JSFiddle for complete working code on the same.
Also, you can show tooltip for legend by creating custom legends (DOM) and add title attribute to it. Please check out the code snippet below.
//Add custom-legends as list and attach click event to that
var legendListId = document.getElementById("legendList");
customLegends(chart,legendListId);
chart.render();

function customLegends(chart, legendListId){
  for(var i=0; i < chart.options.data.length; i++){
    var li = document.createElement("li");
    li.appendChild(document.createTextNode(chart.options.data[i].legendText.slice(0, 10)));
    li.title = chart.options.data[i].legendText;
    legendListId.appendChild(li);
    chart.options.data[i].showInLegend = false;
    li.style.color = chart.options.data[i].color ? chart.options.data[i].color : chart.get("selectedColorSet")[i];
    $('li').each(function (i) {
      $(this).attr('id', (i));
    });
  }

  //Add click event to Custom-Legends being clicked
  $('li').click(function (event) {
    var index = $(this).index();
    var x = document.getElementById(index);
    if (typeof (chart.options.data[index].visible) === "undefined" || chart.options.data[index].visible) {
      chart.options.data[index].visible = false;
    } else {
      chart.options.data[index].visible = true;
    }
    chart.render();
  });
}
Check out this JSFiddle for complete working code.
—-
Manoj Mohan
Team CanvasJS
.