Login to Ask a Question or Reply
You must be logged in to post your query.
Home › Forums › Chart Support › I want to load graph on year change
I want to load graph on year change
- This topic has 8 replies, 2 voices, and was last updated 3 years, 10 months ago by
Manoj Mohan.
-
August 3, 2022 at 2:24 pm #38821
My code is given below
function loadHomePageGraph(){
// alert(1);
var chart = new CanvasJS.Chart(“homefilterchartContainer”,
{
title: {
text: “Select Year From Dropdown”,
verticalAlign: “center”
},
axisX: {
valueFormatString: “DD MM”,
crosshair: {
enabled: true,
snapToDataPoint: true
}
},
axisY: {
title: “Price”,
includeZero: true,
crosshair: {
enabled: true
}
},
data: [{
//showInLegend: true,
type: ‘line’,
showInLegend: true,
markerType: “square”,
//xValueType: “dateTime”,
xValueFormatString:”YYYY MMM DD”,
color: “#F08080”,
name: “series1”,
dataPoints: dataPoints}]
});
$pix_news.ajax({
type : “post”,
dataType : “json”,
url : chartAjax.ajaxurl,
data : {action: “get_graph_filter_yr”},
success: function(response) {
//var jarr=JSON.parse(response);
//alert(jarr.count);
$pix_news.each(response, function(i, field){
console.log(field.min_val);
$pix_news(“.dropdown”).append(“<option value='”+field+”‘>”+field+”</option>”);
});
}
});$pix_news( “.dropdown” ).change(function() {
chart.options.data[0].dataPoints = [];
var e = document.getElementById(“dd”);
var selectedYear = e.options[e.selectedIndex].value;
//alert($pix_news(“#dd”).val());
if( !isNaN(Number(selectedYear)) ) {
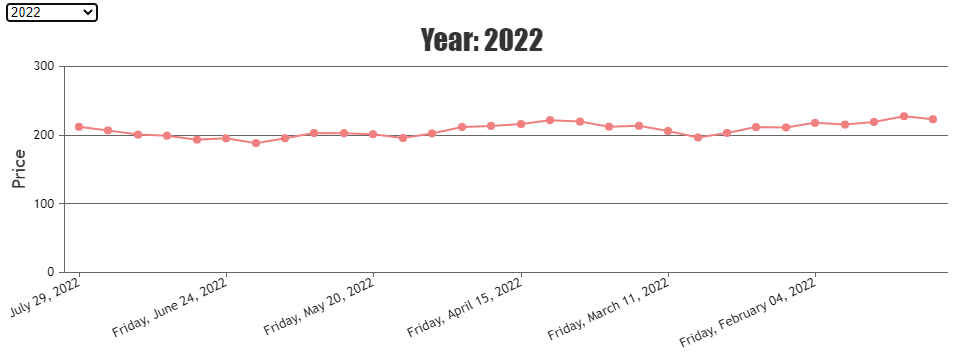
chart.options.title.text = “Year: ” + selectedYear;
chart.options.title.verticalAlign = “top”;
var data = { “curnt_year” : selectedYear }
$pix_news.ajax({
type : “post”,
dataType : “json”,
url : chartAjax.ajaxurl,
data : {action: “get_graph_filter_data”,curnt_year:selectedYear},
success: function(response) {
// alert(response);
//$.getJSON(“getData.php”, data, function(result){
chart.options.data[0].dataPoints = response;
chart.render();
}
})
} else {
chart.options.title.text = “Select Year From Dropdown”;
chart.options.title.verticalAlign = “center”;
}
chart.render()
});
chart.render()// });
}August 3, 2022 at 6:29 pm #38826Can you kindly create sample project with sample data reproducing the issue you are facing & share it with us over Google-Drive or Onedrive so that we can run it locally at our end to understand the scenario better and help you out?
—-
Manoj Mohan
Team CanvasJSAugust 4, 2022 at 12:42 pm #38831Please check the link:
https://drive.google.com/file/d/14xcIS2Gm2u9Fz7rJ_wiljDj-VoLZq-30/view?usp=sharingAugust 4, 2022 at 7:07 pm #38839There are couple of issue in the sample that you have shared. Please find them address below.
1. CanvasJS & jQuery scripts are not present in the project
2. Variable names are not proper across multiple files (getData.php, getSearch.php & index.php).
Below is the code-snippet with the updated variable names./* getSearch.php */ echo json_encode($data_points, JSON_NUMERIC_CHECK); -> echo json_encode($yr_arr, JSON_NUMERIC_CHECK); /* getData.php */ $handle->bindParam(":year",$_POST["year"], PDO::PARAM_INT); -> $handle->bindParam(":year",$_GET["curnt_year"], PDO::PARAM_INT); /* index.php */ $.getJSON("getSearch.php", data, function(result){ -> $.getJSON("getSearch.php", function(response){ . . $.getJSON("getData.php", data, function(result){ -> $.getJSON("getData.php", data, function(response){Please download the updates sample project form here.
—-
Manoj Mohan
Team CanvasJSAugust 5, 2022 at 7:17 pm #38855@manoj-mohan
Thanks you. Yes it is working now. Is there any way to show graph on page load.August 5, 2022 at 7:40 pm #38856@manoj-mohan
If I load two line graph on year change is it possible to show?August 8, 2022 at 4:51 pm #38867Hello @manoj-mohan
I cant not be able to load two graph in onchange event.August 8, 2022 at 6:02 pm #38868Issue solved
August 8, 2022 at 6:10 pm #38869
You must be logged in to reply to this topic.