Login to Ask a Question or Reply
You must be logged in to post your query.
Home › Forums › Chart Support › How to update values in line chart from MySQL DB
How to update values in line chart from MySQL DB
- This topic has 10 replies, 2 voices, and was last updated 4 years, 10 months ago by
Vishwas R.
Tagged: line chart, update value
-
July 29, 2021 at 1:03 am #34967July 30, 2021 at 8:16 pm #34986
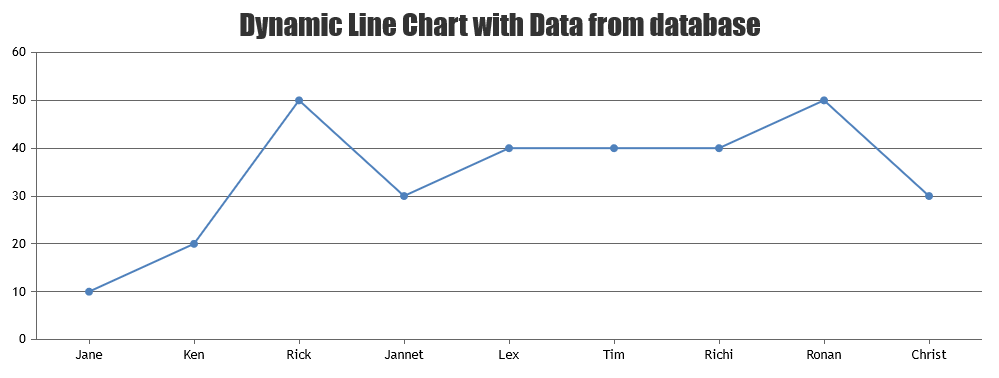
You can update datapoints in the chart for every 2 seconds by changing chart-options & calling chart.render() within setInterval.
setInterval(function() {
	chart.options.data[0].dataPoints.push({x: 10, y: 20});
	chart.render();
}, updateInterval);
To update the same with the data from the database, you need to read data from database & return it from PHP (service.php), parse it to the format accepted by CanvasJS & render the chart. Please find the code-snippet below.
var updateChart = function() {
	$.getJSON("service.php", function(result) {
		dps.splice(0, dps.length);
		$.each(result, function(index, value) {
			dps.push(value);
		});
	});

	chart.render();
};

setInterval(function() {
	updateChart()
}, updateInterval);
Please take a look at this sample project for complete working code.
Also refer to this forum thread and PHP Gallery Page for more examples along with working code. You can also download PHP sample that you can run locally from our download page.
—
Vishwas R
Team CanvasJSJuly 30, 2021 at 9:14 pm #34989Thanks Bro for helping me. But in my case is taking the Lines automatically from MySQL and it makes me confuse.
The example attached is plotting two lines manually..
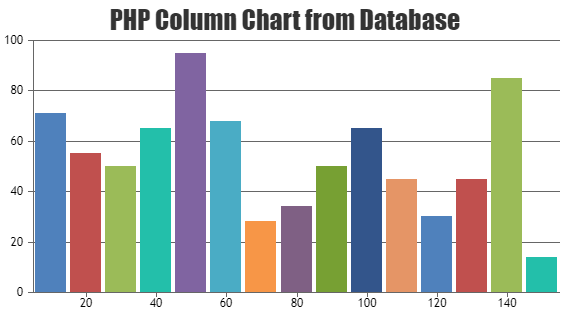
August 2, 2021 at 6:59 pm #35000CanvasJS supports multi-series charts as demonstrated in the previously shared sample. In order to render just one line (single dataseries), you need to pass just one dataseries in the chart-options as shown below.
$.each((data), function(key, value){
	chart.options.data[0].dataPoints.push({label: value[0], y: parseInt(value[1])});
});
Please take a look at this updated sample project for working code. Also refer to PHP Gallery for more set of examples along with source-code.
If you are still facing issue, can you kindly share sample project over Google-Drive or Onedrive along with sample database and brief us further so that we can understand your issue better & help you out?
—
Vishwas R
Team CanvasJSAugust 30, 2021 at 9:18 am #35442September 1, 2021 at 7:44 pm #35596We are looking into your query & get back to you at the earliest.
—
Vishwas R
Team CanvasJSSeptember 2, 2021 at 6:44 pm #35602The sample shared seems to have some dependency issues & is not working locally. Please refer to the screenshot below.
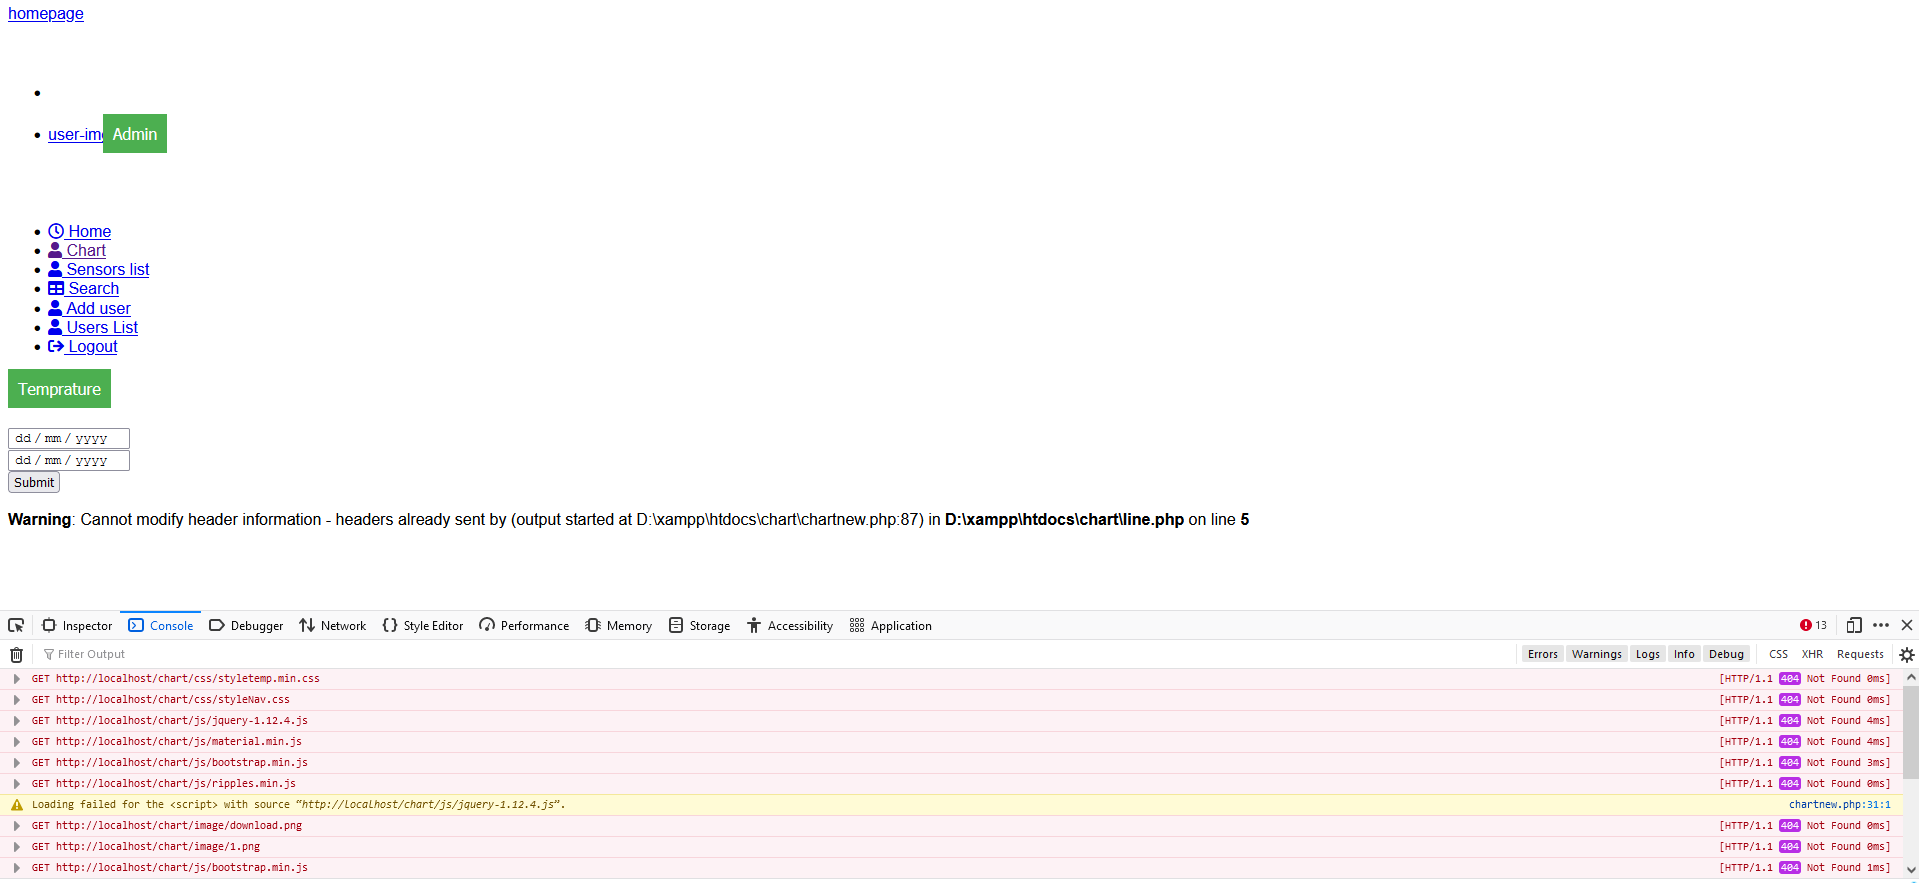
Can you kindly share working sample along with all the dependencies so that we can run it locally, understand the scenario better and help you out?
—
Vishwas R
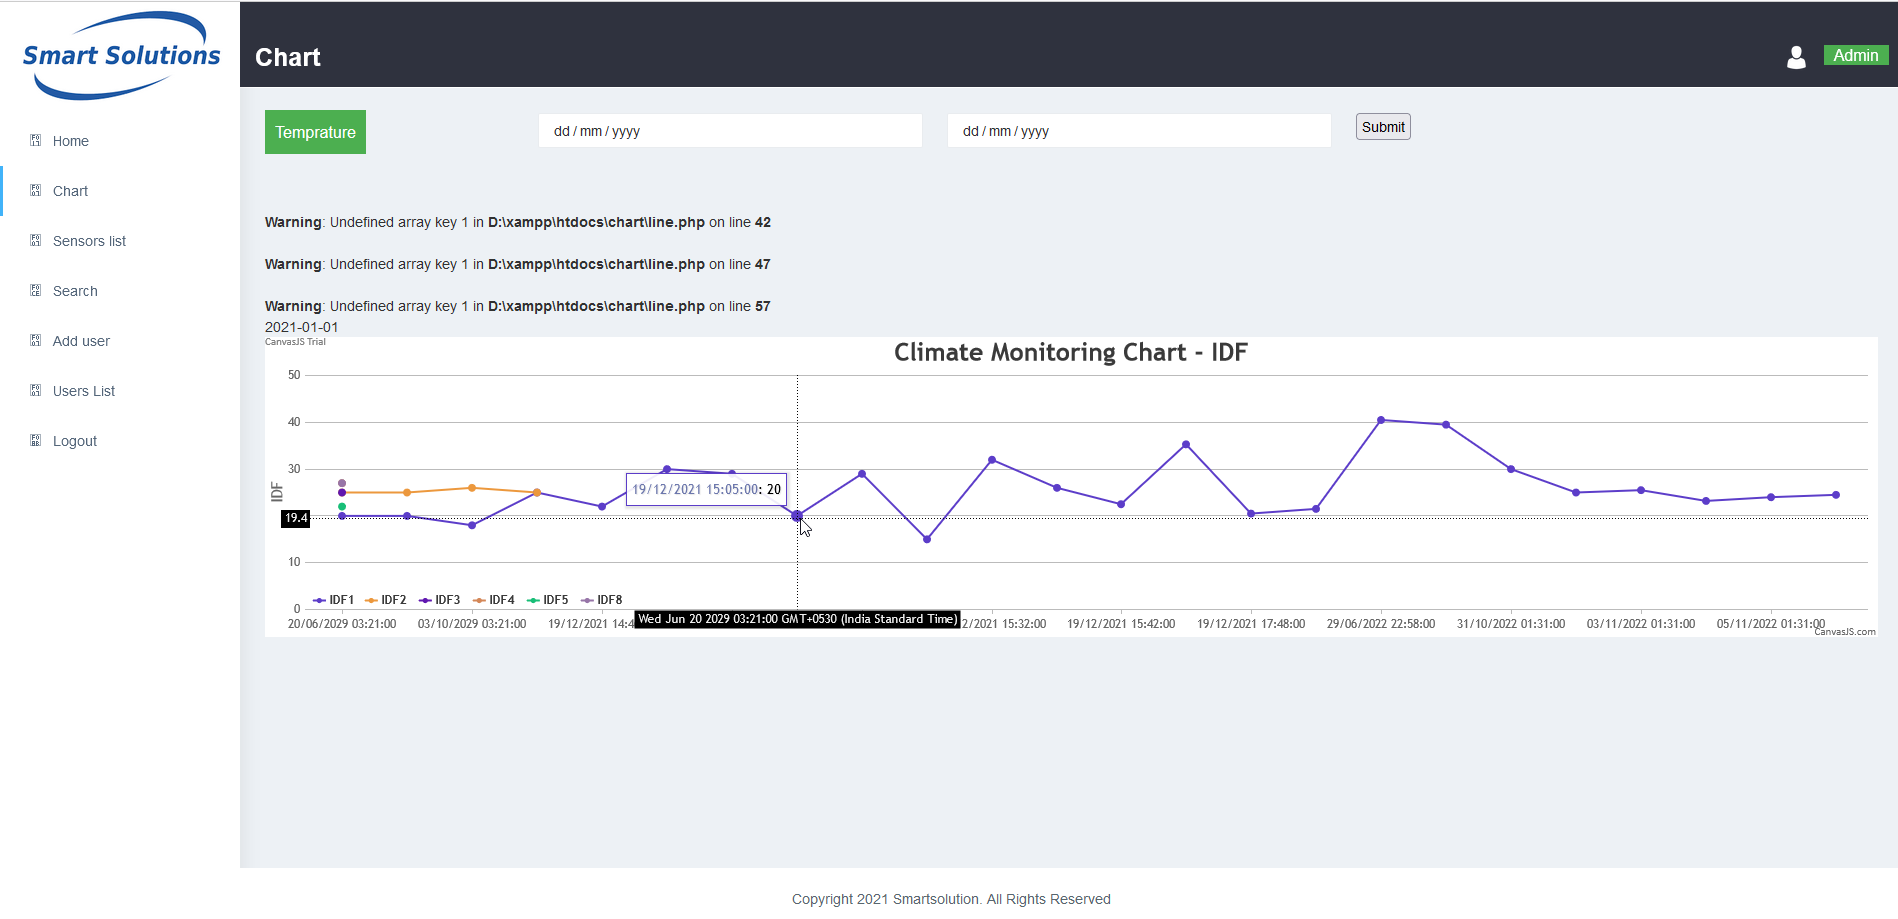
Team CanvasJSSeptember 3, 2021 at 5:59 pm #35609September 6, 2021 at 6:15 pm #35632In the sample project that you have shared, there are couple issues in parsing the data that you are fetching from database. Parsing the response-data properly seems to be working fine. Please take a look at this updated sample project.
—
Vishwas R
Team CanvasJSSeptember 7, 2021 at 1:22 am #35634@Vishwas R
yes now parsing is working, how about the update values from db with interval 10 sec?September 8, 2021 at 6:22 pm #35651You can update datapoints & re-render chart at every 10 seconds with the help of setInterval. Please refer to this forum thread for more information & examples.
—
Vishwas R
Team CanvasJS
Tagged: line chart, update value
You must be logged in to reply to this topic.