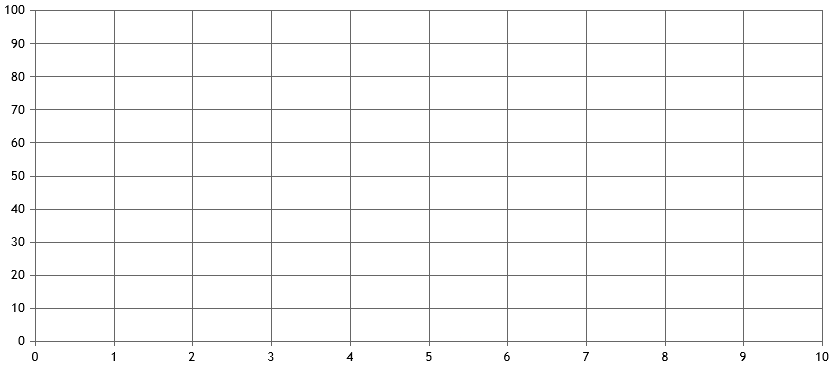
Please tell me how to display an empty datagrid when opening a chart until the user starts connecting the trends he needs. I tried adding axizY with the specified minimum and maximum and data with the visible false parameter, but the datagrid still did not appear until data on the selected trend began to arrive. That is, I want to show an empty grid without data. I use CanvasJSAngularChartsModule with type line “spline”. Thank you.
defaultChartOptions = {
zoomEnabled: false,
zoomType: "x",
theme: "white",
toolTip:{
enabled: true,
shared: true,
animationEnabled: false,
contentFormatter: function ( e ) {
return <code>${CanvasJS.formatDate(e.entries[0].dataPoint.x, "HH:mm:ss")}: ${e.entries[0].dataPoint.y.toFixed(3)}</code>
}
},
axisX:{
interval: 1,
intervalType: "minute",
labelFormatter: function (e) {
return CanvasJS.formatDate( e.value, "HH:mm:ss");
},
gridThickness: 1,
gridColor: "grey",
xValueType: "dateTime",
xValueFormatString: "HH:mm:ss",
crosshair: {
enabled: true,
snapToDataPoint: true,
labelFormatter: function (e) {
return CanvasJS.formatDate( e.value, "HH:mm:ss");
},
},
stripLines: [],
labelWrap: false,
labelAutoFit: true,
labelAngle: 0
},
axisY: {
interval: 10,
minimum: 0,
maximum: 100
},
data: []
};
