@hong-zhang,
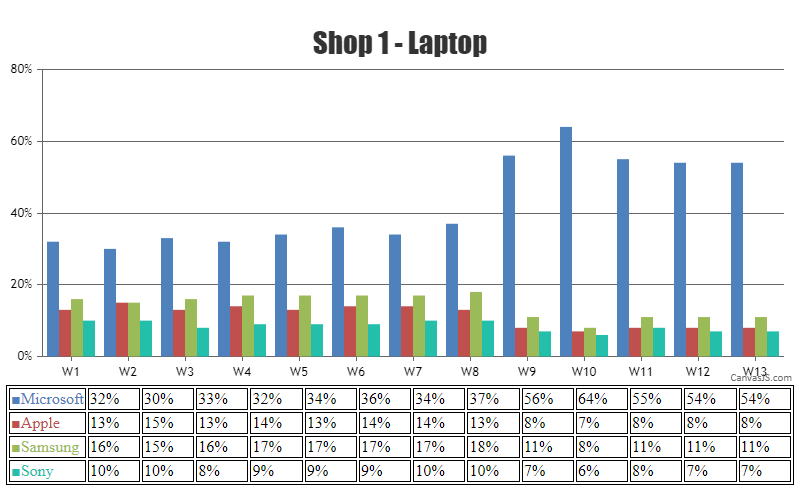
You can create a table which shows data represented in the graph with a few lines of code. Please find the code-snippet below,
function addTable(chart){
	var tableData = "";
	for(var i = 0; i < chart.data.length; i++){
  		tableData += "<tr>" + "<td style='color:" + chart.data[i].color + "'>■" + chart.data[i].name + "</td>";
      for(var j = 0; j < chart.data[i].dataPoints.length; j++){
      	tableData += ("<td>" + chart.data[i].dataPoints[j].y +"%</td>")
      }
      tableData += "</tr>";
  }
  $("#chartData").append(tableData)
}
Kindly take a look at this JSFiddle for the complete code.
—
Adithya Menon
Team CanvasJS
.