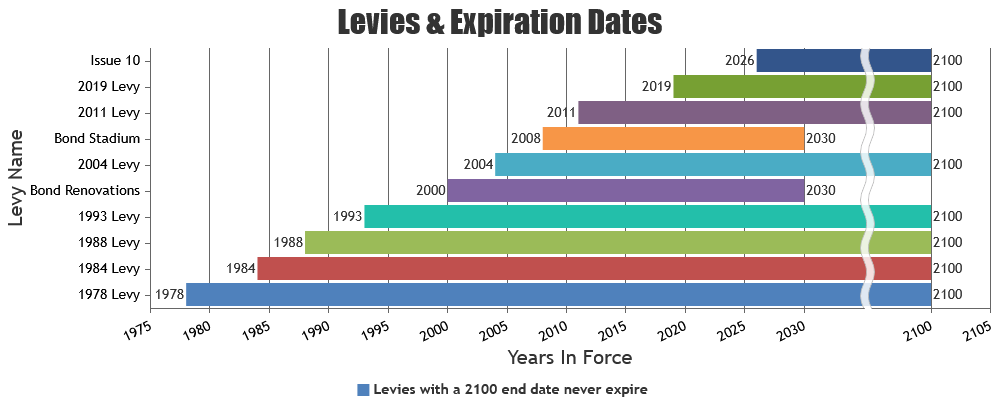
I am trying to make a very generic bar chart where the width of the bar depicts a start year and an end year of a number school levies and bonds. The problem is the numbers keep defaulting to a regular number, and thus a four digit year is appearing with a comma between the left most digit and the next three. When I try to use formatting to force #### or YYYY those actual letters appear in the label (both under the graph an inside of it).
How can I make these look like years without a comma?
`window.onload = function () {
var chart3 = new CanvasJS.Chart(“chartContainer3”, {
animationEnabled: true,
exportEnabled: true,
title: {
text: “Levies & Expiration Dates”
},
axisX: {
title: “Levy Name”,
ValueFormatString: “####”
},
axisY: {
title: “Years In Force”,
scaleBreaks: {
type: “wavy”,
customBreaks: [{
startValue: 2035,
endValue: 2095
}
]},
ValueFormatString: “####”
},
data: [{
type: “rangeBar”,
showInLegend: true,
indexLabel: “{y[#index]}”,
yalueFormatString: “YYYY”,
legendText: “Levies with a 2100 end date never expire”,
toolTipContent: “<b>{label}</b>: {y[0]} to {y[1]}”,
dataPoints: [
{ x: 10, y:[1978, 2100], label: “1978 Levy” },
{ x: 20, y:[1984, 2100], label: “1984 Levy” },
{ x: 30, y:[1988, 2100], label: “1988 Levy” },
{ x: 40, y:[1993, 2100], label: “1993 Levy” },
{ x: 50, y:[2000, 2030], label: “Bond Renovations” },
{ x: 60, y:[2004, 2100], label: “2004 Levy” },
{ x: 70, y:[2008, 2030], label: “Bond Stadium” },
{ x: 80, y:[2011, 2100], label: “2011 Levy ” },
{ x: 90, y:[2019, 2100], label: “2019 Levy” },
{ x: 100, y:[2026, 2100], label: “Issue 10” }
]
}]
});
chart3.render();
.