@bomb,
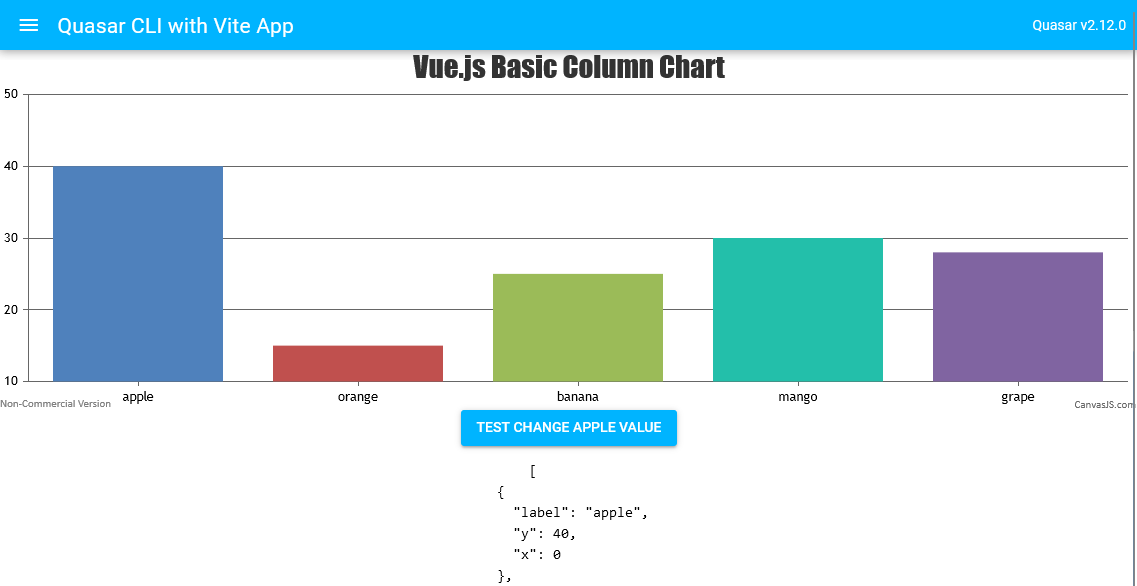
Updating datapoint value via chart option and re-rendering the chart seems to be working fine. To do so, you need to get the reference to the chart by passing the call-back function like @chart-ref="chartRef" to the component. Please refer to the code-snippet below.
// Getting Chart Reference
<CanvasJSChart :options="options" @chart-ref="chartRef" />

chartRef(chart) {
  this.chart = chart;
}

// Updating Datapoint value
this.chart.options.data[0].dataPoints.filter(
	(item) => (item.label == 'apple')
)[0].y = 40;
this.chart.render();
Please take a look at this updated Stackblitz for complete code.
—
Vishwas R
Team CanvasJS
.