Login to Ask a Question or Reply
You must be logged in to post your query.
Home › Forums › Chart Support › How to hide data or label when the value is 0
How to hide data or label when the value is 0
- This topic has 3 replies, 2 voices, and was last updated 8 years ago by
Gnutzmann.
-
July 26, 2018 at 5:18 pm #21990
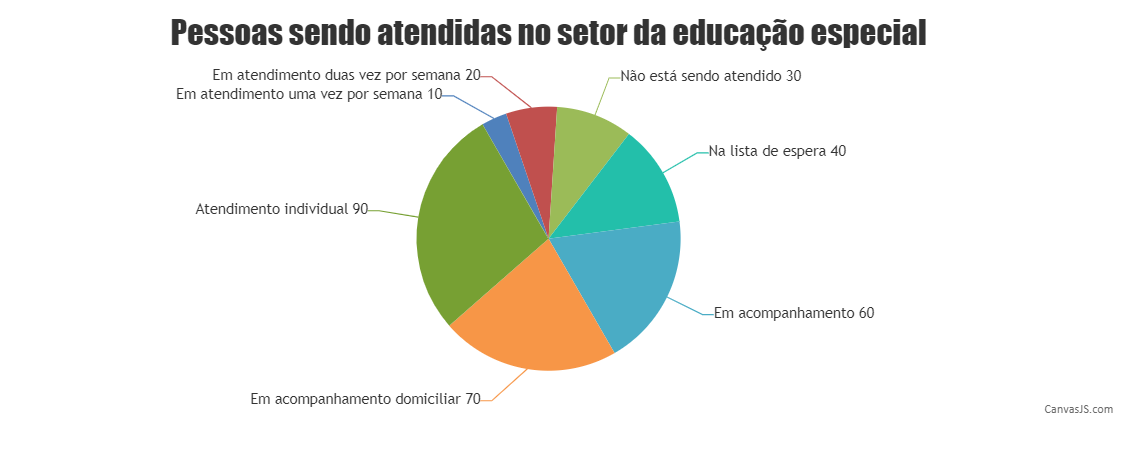
I have a pie chart and some values are 0 and some are not.
I’m using PHP with it, but when i try this function:function hideIndexLabel() { var length = chart.options.data[0].dataPoints.length; for( i = 0; i < length; i++ ) { if( chart.options.data[0].dataPoints[i].y === 0 || chart.options.data[0].dataPoints[i].y === null ) { chart.options.data[0].dataPoints[i].indexLabel = ""; } else chart.options.data[0].dataPoints[i].indexLabel = chart.options.data[0].dataPoints[i].indexLabel; } } hideIndexLabel();It doesn’t work because I am not using the native JS script for dataPoints.
Can someone help me?My code:
(ahead just data coming from the database)$dataPoints = array( array("y" => $S, "label" => "Em atendimento uma vez por semana"), array("y" => $S2, "label" => "Em atendimento duas vez por semana"), array("y" => $N, "label" => "Não está sendo atendido"), array("y" => $LE, "label" => "Na lista de espera"), array("y" => $AV, "label" => "Em avaliação"), array("y" => $AC, "label" => "Em acompanhamento"), array("y" => $AD, "label" => "Em acompanhamento domiciliar"), array("y" => $SG, "label" => "Atendimento Grupal"), array("y" => $SI, "label" => "Atendimento individual") ); ?> <script> window.onload = function() { var chart = new CanvasJS.Chart("chartContainer", { animationEnabled: true, title: { text: "Pessoas sendo atendidas no setor da educação especial " }, data: [{ type: "pie", startAngle: 240, indexLabel: "{label} {y}", dataPoints: <?php echo json_encode($dataPoints, JSON_NUMERIC_CHECK); ?> }] }); function hideIndexLabel() { for(var i = 0; i < chart.options.data[0].dataPoints.length; i++) { if(chart.options.data[0].dataPoints[i].y === 0) chart.options.data[0].dataPoints[i].indexLabel = ""; } } hideIndexLabel(); chart.render(); } </script> </head> <body> <div id="chartContainer" style="height: 370px; max-width: 920px; margin: 0px auto;"></div> <script src="canvasjs.min.js"></script> </body> </html>July 27, 2018 at 12:09 pm #22002While you are updating the indexLabel of dataPoints with y-value 0 or null, you can also set the indexLabelLineThickness to 0 so that they are not displayed on the pie chart. The code snippet below shows how you can achieve the same:
function hideIndexLabel() {
  var length = chart.options.data[0].dataPoints.length;
  for(var i = 0; i < length; i++ ) {
    if( chart.options.data[0].dataPoints[i].y === 0  || chart.options.data[0].dataPoints[i].y === null ) {
      chart.options.data[0].dataPoints[i].indexLabel = " ";
      chart.options.data[0].dataPoints[i].indexLabelLineThickness = 0;
    }
    else
      chart.options.data[0].dataPoints[i].indexLabel = chart.options.data[0].dataPoints[i].indexLabel;
  }
}
Please take a look at this updated sample project for a working example with sample code.
__
Priyanka M S
Team CanvasJSJuly 28, 2018 at 6:50 pm #22029Thank you so much
You must be logged in to reply to this topic.