You must be logged in to post your query.
Home › Forums › Chart Support › How to create detailed chart description
Hello,
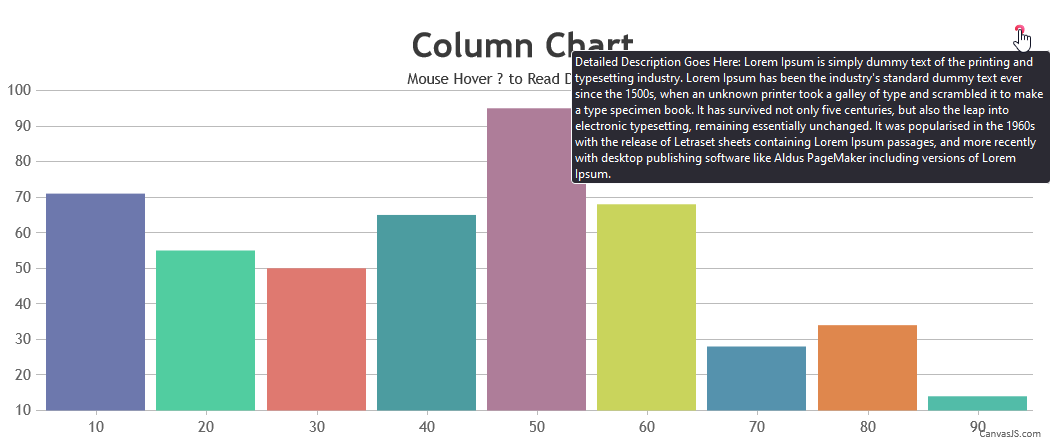
I’m looking for a way to add a detailed description (ie, 4-5 sentences) to each of my charts. My thought was to make it appear when a user mouses over the title. Is there a simple way to do that?
My other thought was to put a small “?” image next to the title or in the corner of the chart, and when a user clicks that, it would popup on the chart. I’m open to other suggestions as well.
Any thoughts? If so, hopefully you can point me to a detailed example as I’m a js novice.
Thanks in advance!
@hyphenfi,
You can place an icon (info or question-mark) to the top-right of the chart & pass description as title attribute of the icon. The description will be shown in a tooltip on hovering the icon. Please take a look at this JSFiddle for an example.
Also, you can convert it to a JavaScript function so that you can add information for multiple charts. Please refer to this JSFiddle for an example on the same.
— Vishwas R Team CanvasJS
You must be logged in to reply to this topic. Login/Register