Hello Everyone,
I have an issue with recreating the RangeAreaandline Chart with minimum and maximum values. with the function that computes the average. I have average data points and I want to include them in the chart instead of computing them. and also allow the addAverageSeries line to show. Please how will I go about it also can I use Axios to bring external data including the three data points and have them working?
I do not know how to use fiddle but you can check this google drive shared link to see the code. Thanks
https://drive.google.com/file/d/1Hsyx0idnbygvlJQmHVh7FSOb4faCnRx6/view?usp=drive_link.
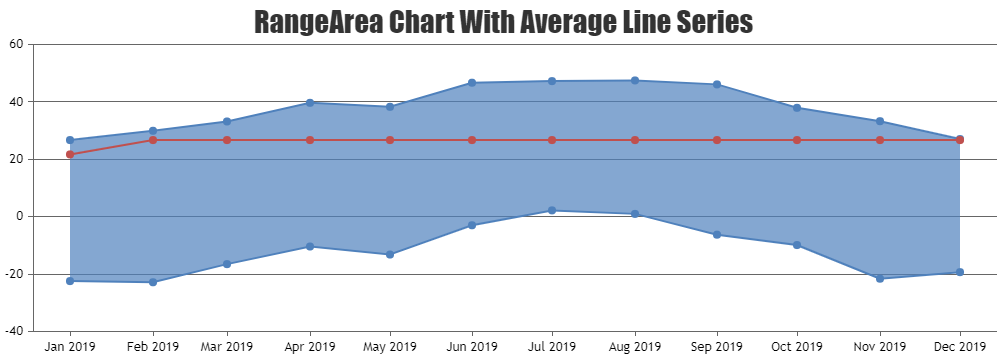
this is the data i wish to use to replace the one in the code
dataPoints: [
{ x: new Date(2019, 0, 1), y: [-22.4332, 21.701, 26.701] },
{ x: new Date(2019, 1, 1), y: [-22.8482, 26.701, 29.9354] },
{ x: new Date(2019, 2, 1), y: [-16.5272, 26.701, 33.1793] },
{ x: new Date(2019, 3, 1), y: [-10.3894, 26.701, 39.6753] },
{ x: new Date(2019, 4, 1), y: [-13.1862, 26.701, 38.289] },
{ x: new Date(2019, 5, 1), y: [-2.9892, 26.701, 46.6849] },
{ x: new Date(2019, 6, 1), y: [2.20233, 26.701, 47.2412] },
{ x: new Date(2019, 7, 1), y: [0.975366, 26.701, 47.4759] },
{ x: new Date(2019, 8, 1), y: [-6.26288, 26.701, 46.0959] },
{ x: new Date(2019, 9, 1), y: [-9.87604, 26.701, 37.9325] },
{ x: new Date(2019, 10, 1), y: [-21.6, 26.701, 33.2763] },
{ x: new Date(2019, 11, 1), y: [-19.3211, 26.701, 27.0527] }
]
.