Home Forums Chart Support How do I Layer multiple years by month

How do I Layer multiple years by month

Viewing 2 posts - 1 through 2 (of 2 total)
  • #42568

    I’d like to layer multiple years worth of data but show the years by month.
    it seems it creates one continuous data set, but I want to have them stacked, not a single line.
    so 5 years of data should be 5 stacked lines.
    How do I do this?

    #42582

    @amiddleton,

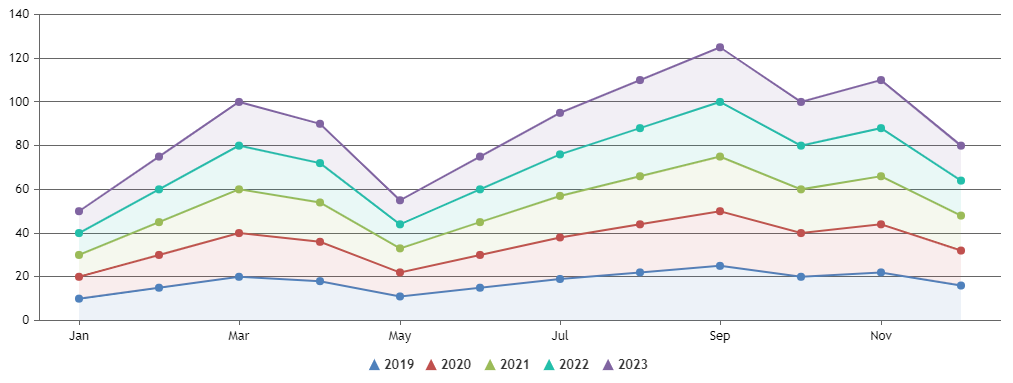
    To display data by month for multiple years in the form of a stack you can use a stackedArea chart and set the fillOpacity for each dataseries to 0 if you just want to render the lines and not the shaded region below. In case you want to want to render both the line and the shaded area below with lesser transparency, you can set fillOpacity to a minute value like 0.1 or 0.2. We suggest you to use labels for the months instead of passing date-time values to x-value.

    Please check this JSFiddle for a working example.

    Stacked area chart for multiple years


    Thangaraj Raman
    Team CanvasJS

Viewing 2 posts - 1 through 2 (of 2 total)

You must be logged in to reply to this topic.