You must be logged in to post your query.
Home › Forums › Chart Support › How do I highlight selected points in scatter plot?
Tagged: click, highlight point, scatter plot
Hello,
Please have a look at this JSFiddle: https://jsfiddle.net/d78w6e5t/
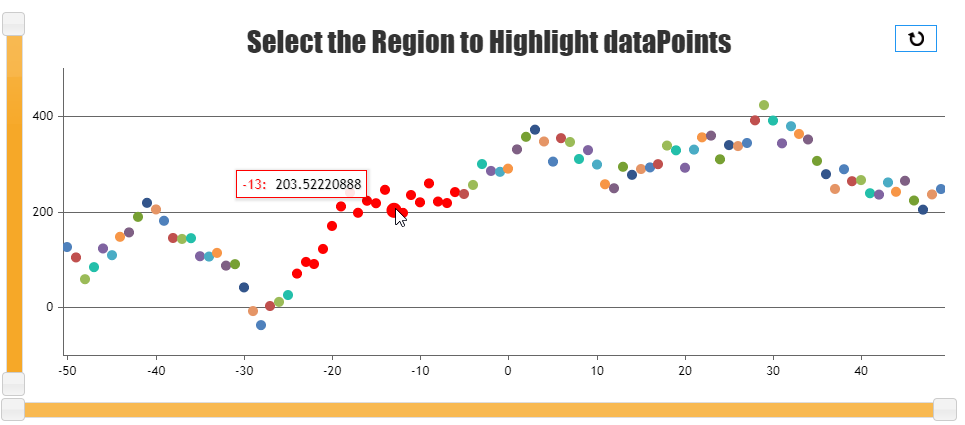
I’m trying to highlight the data points red when the user clicks on them. I’m doing this in the click event listener and the selectPoint() function. This is the code from the selectPoint() function:
function selectPoint(point) { selectedDataPoints.push(point); point.markerColor = 'red'; }
This seems to color the point red only when you hover over it. But as soon as you move the mouse out, it returns to its original color (and size).
Can anyone see what I’m doing wrong?
Thank you!
@gibran-shah,
You can use datapoint / dataseries click event-handler to change the color of the datapoint on clicking them. Please refer to the code-snippet below.
click: function(e) { e.chart.options.data[e.dataSeriesIndex].dataPoints[e.dataPointIndex].color = "red"; e.chart.render(); }
Please take a look at this updated JSFiddle for working code.
— Vishwas R Team CanvasJS
Thank you Vishwas, that worked like a charm!
You must be logged in to reply to this topic. Login/Register