You must be logged in to post your query.
Home › Forums › Chart Support › How can my add data navigator (1d,1w,1m,1y) function to my line chart?
Dear Canvasjs Support,
Here is my site. Line chart from CSV file.
https://rtmc.csc1999.com/2019_PME_L1/pme_L1_G.html
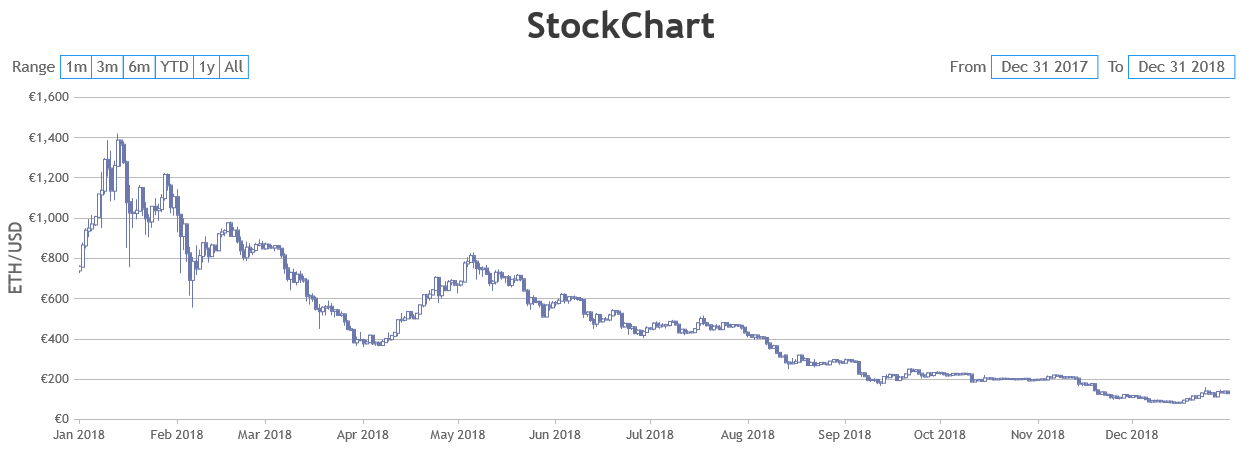
As the data gets larger, May I know how can I add a data navigator like in this stock chart?
The one like in “Combination Charts & Shared Tooltip”.
Any help would be appreciated.
Regards, Aung
Aung,
Range Selector is a part of StockChart, and not Chart. Using StockChart instead of Chart should fulfill your requirement.
__ Ananya Deka Team CanvasJS
You must be logged in to reply to this topic. Login/Register