You must be logged in to post your query.
Home › Forums › StockChart Support › Graph with CSV data
Tagged: csv
Is it possible to draw any type of graph with CSV file data?
@usha,
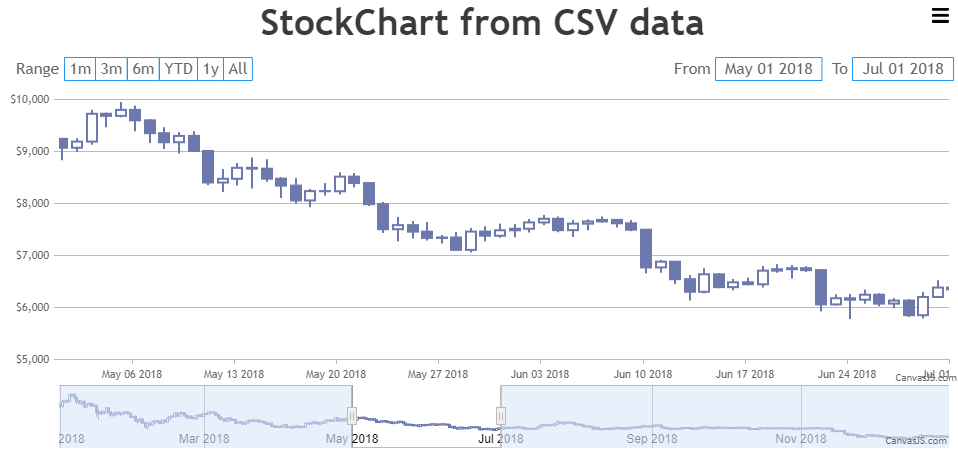
Yes, you can draw all chart types available in CanvasJS using CSV data. You will have to get the CSV Data using AJAX call and convert the same to the format accepted by CanvasJS as shown in the code snippet below –
function getDataPointsFromCSV(csv) { var dataPoints = csvLines = points = []; csvLines = csv.split(/[\r?\n|\r|\n]+/); for (var i = 1; i < csvLines.length; i++) if (csvLines[i].length > 0) { points = csvLines[i].split(","); dataPoints.push({ x: new Date(points[0]), y: [parseFloat(points[1]), parseFloat(points[2]), parseFloat(points[3]), parseFloat(points[4])] }); } return dataPoints; }
Please take a look at this JSFiddle for a working example.
___________ Indranil Deo Team CanvasJS
Hey, I have one more doubt, I have created a donut chart and wanna add labels as legends (Link). But, when I added “showInLegend: true”, it’s showing “DataPoint: 1 & DataPoint: 2” instead of “Technical Recruiters & Hiring Managers” respectively. Please, guide me. (FYI, I am using data from CSV file to create my Donut Chart)
You can show custom text in legend-items by setting legendText property (which falls back to name property). You can achieve this by passing legendText property along with label for each dataPoint as shown in the below code-snippet.
dataPoints.push({ label: (points[0]), legendText: (points[0]), y: parseFloat(points[1]) });
If you are still facing issue, kindly create JSFiddle reproducing the issue you are facing and share it with us so that we can look into the code / chart-options being used, understand the scenario better and help you resolve.
You must be logged in to reply to this topic. Login/Register