Login to Ask a Question or Reply
You must be logged in to post your query.
Home › Forums › Chart Support › Fix date on x-axis
Fix date on x-axis
- This topic has 6 replies, 2 voices, and was last updated 4 years, 4 months ago by
Thangaraj Raman.
-
February 4, 2022 at 10:16 am #36870
Hi,
I use label parameter for fix date on x axis from database but issue is that when same date record is retrieve then it create another parameter with same dat.knidly facilitate in this regard.data is retrieving from database using ajax call thanks`var result = ajax_call(‘../data_access_layer/event_mgt_dal.php’,data, true,”,’json’);
if(result)
{
$(‘#chartContainer’).show();
var fix_date= new Date(result[0].VENUE_DATE);
var data = [];
var index = 0;
data[0] = {label:’ ‘,y:[new Date(2016, 1, 15, 08, 00, 00),new Date(2016, 1, 15, 08, 00, 00)]}
for(var i=0;i<result.length;i++)
{
index++;
var venue_date = new Date(result[i].VENUE_DATE);
split_stime = result[i].VENUE_STIME.split(“:”);
split_etime = result[i].VENUE_ETIME.split(“:”);
data[index] = {label:venue_date.getDate()+”-“+(venue_date.getMonth()+1)+”-“+venue_date.getFullYear(),y:[new Date(2016,1,15,split_etime[0],split_etime[1],0),new Date(2016,1,15,split_stime[0],split_stime[1],0)],z:result[i].EVENT_NAME+” (“+result[i].VENUE+”)”}
}
data[index+1] = {label:’ ‘,y:[new Date(2016, 1, 15, 21, 21, 21),new Date(2016, 1, 15, 21, 21, 21)]}var dps = data;
var chart = new CanvasJS.Chart(“chartContainer”, {
theme: “light2”, // “light1”, “light2”, “dark1”, “dark2”
animationEnabled: true,
title: {
text: “Booked Venues Detail”,
fontSize: 35
},
axisY: {
title: “Time Slots”,
interval: 1000*60*60, //It is set for 1 hour in timestamp
minimum: new Date(2016, 1, 15, 6, 00, 00),
maximum: new Date(2016, 1, 15, 22, 00, 00),
titleFontSize : 20,
labelFormatter: function (e) {
return CanvasJS.formatDate( e.value, “HH” + “:00”); //For showing dateTime format in Y axis
}
},
axisX: {
title: “Dates”,
/*interval: 1,
intervalType: “month”,*/
valueFormatString: ” “,//DD MMM YYYY
titleFontSize : 20,
},
toolTip:{
contentFormatter: function (e) {
return e.entries[0].dataPoint.z+”<br />Start Time:”+CanvasJS.formatDate(e.entries[0].dataPoint.y[1],”HH:mm”) + “<br />End Time:” + CanvasJS.formatDate(e.entries[0].dataPoint.y[0],”HH:mm”);//Formatting dateTime in ToolTip
}
},
data: [{
type: “rangeColumn”,
color: “#369EAD”,
showInLegend: true,
dataPoints: []
}]
});
changeDateTimeToTimestamp(dps);function changeDateTimeToTimestamp (data){
for(var i = 0; i < data.length; i++){
for(var j = 0;j < data[i].y.length; j++){
if(data[i].y[j].getTime)
data[i].y[j] = data[i].y[j].getTime();
}
}
chart.options.data[0].dataPoints = dps;
chart.render();
}February 4, 2022 at 7:26 pm #36876Can you kindly brief us further about your requirement along with a pictorial representation and also create a sample project reproducing the issue you are facing and share it with us over Google-Drive or Onedrive along with sample data so that we can look into your code, run it locally at our end to understand the scenario better, and help you out?
—
Thangaraj Raman
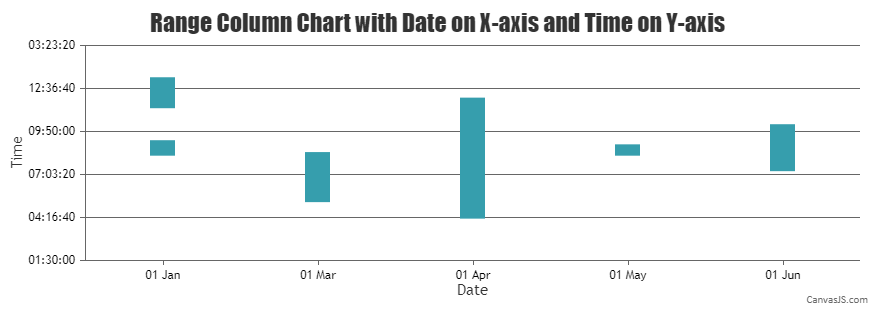
Team CanvasJSFebruary 8, 2022 at 10:05 am #36897I am using rangecolumn chart.The dates on x-axis retrieving from database.Scenerio is that same date has different time slots.in my code whenever a date which has more than one time slot it repeat itslef which is logically wrong.e.g. record (2012-01-01) has two time slots.means i want fix dates on x-axis retrieving from database using ajax call.i am using label parameter because if i use ‘x’ parameter date make itself interval i want fix dates.thanks
February 8, 2022 at 10:46 am #36902i’m unable to attach link for the code link of google drive.may be some error while sending link kinldy facilitate regrading this issue so that i can send you my example code to you.
February 8, 2022 at 5:34 pm #36901i’m unable to attach link for the code link of google drive.may be some error while sending link kinldy facilitate regrading this issue so that i can send you my example code to you.
https://drive.google.com/file/d/1RG8hpqECtoBHZTjy3FP5hHYwSi1MTfp4/view?usp=sharingFebruary 8, 2022 at 5:36 pm #36898this is the code file of my work
https://jsfiddle.net/1aLrf85y/February 9, 2022 at 12:10 am #36911You can convert the x-values to labels and combine dataPoints with the same date using similar x-values. Please find the code snippet for the same below.
function setXValue(data) {
  var xValue = 0;
  for(var i = 0; i < data.length; i++) {
    if(data[i+1] && data[i].x.getTime() === data[i+1].x.getTime()) {
      data[i].label = data[i].x;
      data[i].x = xValue;
    }
    else {
      data[i].label = data[i].x;
      data[i].x = xValue;
      xValue++
    }
  }
  return data
}
Please take a look at this JSFiddle for a working example.
—
Thangaraj Raman
Team CanvasJS
You must be logged in to reply to this topic.