Login to Ask a Question or Reply
You must be logged in to post your query.
Home › Forums › Chart Support › Find max peak on spline chart
Find max peak on spline chart
- This topic has 6 replies, 2 voices, and was last updated 4 years, 4 months ago by
dunhamcd.
-
May 29, 2021 at 2:01 am #34464
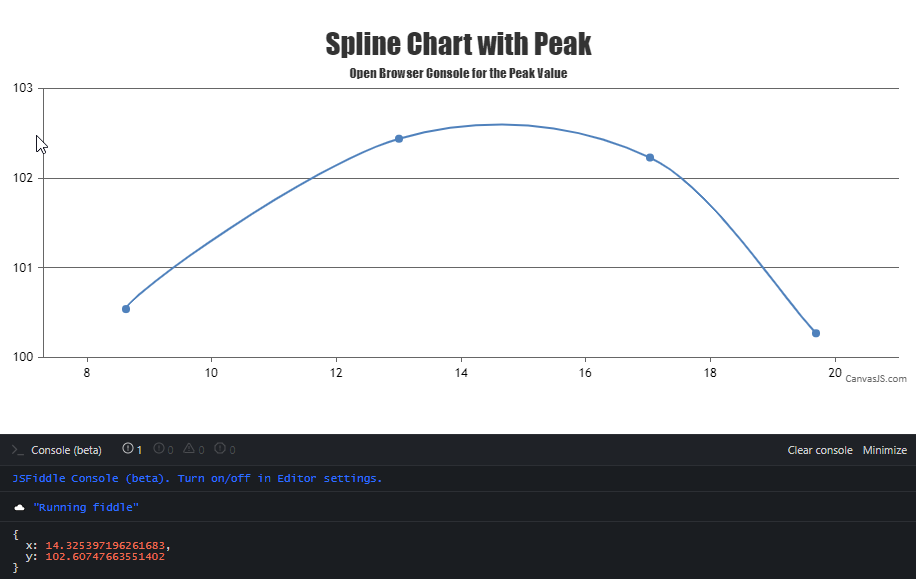
From the chart object, is there a way to get the max x and y values from a spline chart? Alternatively, is there a way to get a formula on how the line was drawn?
Here is a jsfiddle for an example of the chart. https://jsfiddle.net/26c9a5yq/1/
The max is somewhere around where y ~ 102.5 and x ~ 15ish.
June 2, 2021 at 7:05 pm #34501CanvasJS uses Bézier curve interpolation to represent the curve passing through the given dataPoints. We don’t have any property to find the coordinates of the highest / lowest peak as of now. However, you can achieve the same by getting the image from the rendered chart & processing it to find the colored pixel-coordinate from top to bottom. Later you can use convertPixelToValue to get the value corresponding to the pixel-coordinate as shown in the code-snippet below,
var imageData = chart1.ctx.getImageData(chart1.plotArea.x1, chart1.plotArea.y1, chart1.plotArea.width, chart1.plotArea.height).data;

coloredRegionData = [];
for (var i = 0; i < imageData.length; i += 4) {
    if (i % (4 * chart1.plotArea.width) === 0) {
      coloredRegionData.push([]);
      temp = i;
    }
    if (imageData[i] === 255 && imageData[i+1] === 0) {
      coloredRegionData[coloredRegionData.length - 1].push((i - temp) / 4);
    }
}

splinePixelCordinates = [];
for (var i = 0; i < coloredRegionData.length; i++) {
    for (j = 0; j < coloredRegionData[i].length; j++) {
      splinePixelCordinates.push({
        x: chart1.plotArea.x1 + coloredRegionData[i][j],
        y: chart1.plotArea.y1 + i
      })
    }
}
Please take a look at this JSFiddle for an example on finding the coordinates of the highest / lowest peak.
—
Adithya Menon
Team CanvasJSJune 3, 2021 at 12:07 am #34504This is perfect! Thanks for sending this over.
February 25, 2022 at 11:08 am #37024I am having an issue that has come up with a specific set of points using the code provided. I have a JS fiddle that can demonstrate the issue. There are two sets of points provided in the example – one that works as expected, and one that is not calculating the peak correctly. Any direction would be helpful.
https://jsfiddle.net/3tL60wzy/
Let me know if you need any more information in order to review, etc.
February 28, 2022 at 6:17 pm #37045Thanks for the JSFiddle. We are looking into your query and will get back to you at the earliest.
____
Adithya Menon
Team CanvasJSMarch 1, 2022 at 6:54 pm #37056We don’t have any property to find the coordinates of the highest / lowest peak as an inbuilt feature for now. However, with a few lines of code, it’s possible to find the same using canvas API, which we have showcased in the example shared in the previous reply. The same can be further improved to make it work across different sets of datapoints. Below is the code-snippet which gets the image-data of canvas to find the top-most colored pixel coordinate. Converting the same to value-coordinate using convertPixelToValue will give you the y-value of the highest peak in the curve/spline chart,
for (var i = 0; i < imageData.length; i += 4) {
  if (i % (4 * parseInt(chart1.plotArea.width)) === 0) {
    coloredRegionData.push([]);
    temp = i;
  }
  if (imageData[i] === 255 && imageData[i + 1] === 0)
    coloredRegionData[coloredRegionData.length - 1].push((i - temp) / 4);
}
Please take a look at this updated JSFiddle for complete code.
____
Adithya Menon
Team CanvasJSMarch 2, 2022 at 9:26 am #37060Thanks for figuring that out for me! Appreciate your time looking at this for me.
Thanks
Chad
You must be logged in to reply to this topic.