Login to Ask a Question or Reply
You must be logged in to post your query.
Home › Forums › Chart Support › Emtpy charts
Emtpy charts
- This topic has 7 replies, 2 voices, and was last updated 5 years ago by
Manoj Mohan.
-
June 11, 2021 at 9:37 pm #34594
Hi,
I’m just trying to follow your simple example of a chart from a mySQL database
Substituting my own connection details I can get a connection to the DB and it returns data however the chart is empty. I’ve added a print_f to the code to see the output of $dataPoints and it shows as the following:
Array
(
[0] => Array
(
[x] => 2021-06-11 15:52:20
[y] => 7
)[1] => Array
(
[x] => 2021-06-11 15:52:04
[y] => 7
)[2] => Array
(
[x] => 2021-06-11 15:51:38
[y] => 9
))
Any ideas?
Thanks
June 14, 2021 at 7:00 pm #34626It seems like you are passing the date-time string to dataPoints. To display the chart containing date-time value in PHP, you need to first convert date-time string to PHP timestamp using strtotime(). Later convert PHP timestamp value to javascript timestamp and assign that value to dataPoint x-value in the following format –
[x]=> (strtotime(“2021-06-11 15:51:38”)*1000)
Please take a look at this sample project for an example on rendering the chart in PHP using date-time values data from database.
—-
Manoj Mohan
Team CanvasJSJune 15, 2021 at 3:24 pm #34638Hi,
Thanks for the reply. I’ve used your sample project and that works fine. I’ve then changed the DB to point to my data, and I get better results than I was before :) However instead of an empty graph I now get a few columns but a lot of the data is also missing, the image below is with the limit set to 1000
href=”https://i.imgur.com/Vm0szYf.png”
Also noted that adding a limit statement to the mySQL casues the lines to disappear if the returned results is < 100. My data is very simple its a timestamp and a number (There are lots of other columns in the mySQL, but these are the only 2 I’m interested in for the graph. The timestamp will be approx every 60seconds, which I want to limit in the graph to say the last 20 results or so.
Regards,
Mike
-
This reply was modified 5 years ago by
syngress.
June 16, 2021 at 10:44 am #34646Mike,
Can you kindly create sample project reproducing the issue you are facing and share it with us over Google-Drive or Onedrive along with sample data so that we can run it locally at our end to understand the scenario better and help you out?
—-
Manoj Mohan
Team CanvasJSJune 17, 2021 at 3:28 pm #34668Hi,
Thanks for the help, I figured out the cause, the other value (not the timestamp) was being stored as a string, and as such needed to be changed to an Int for the graph to work properly!!
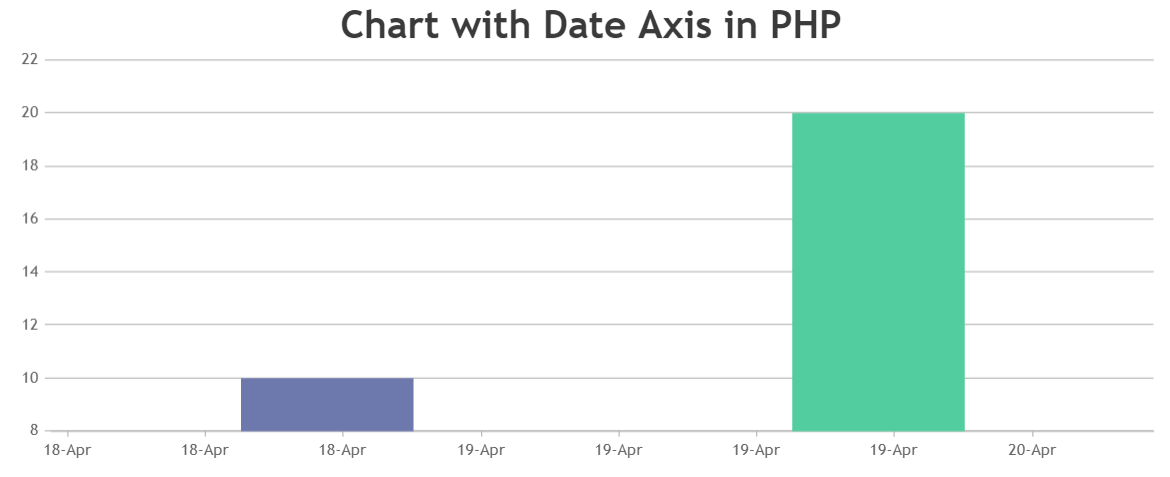
I know need to figure out how to get the x-axis to show as I’d like, at the moment the x-axis is from a timestamp, however the results I get in the database from my system are not exact times, so not always 1 minute intervals, and sometimes there can be long gaps between data being received. This causes an issue in the graph where I cant seem to display the actual timestamp from the DB on the x-axis, this is most likely me needing to figure out the settings required for the x-axis. At the moment the config for x-axis is:
axisX:{
valueFormatString: “DD-MM-YY HH:mm:ss”,
intervalType: “hour”,
interval: 24
},
data: [{
type: “line”,
xValueType: “dateTime”,This results in a graph such as:
What I’d really like is for each of the data points to have the timestamp on the x-axis. you can see what I mean with the long downward slope in the middle this is where there is no data in the DB for that time period.
Thanks,
Mike
June 18, 2021 at 9:09 pm #34682Mike,
axisX:{
valueFormatString: “DD-MM-YY HH:mm:ss”,
intervalType: “hour”,
interval: 24
},Axis Labels are rendered at every interval based on the value of intervalType. Since you are setting the interval as 24 hours, axis labels will be shown for every 24 hours.
What I’d really like is for each of the data points to have the timestamp on the x-axis. you can see what I mean with the long downward slope in the middle this is where there is no data in the DB for that time period.
You can pass label instead of x values to dataPoints for displaying timestamp for each dataPoints.
—-
Manoj Mohan
Team CanvasJSJune 20, 2021 at 5:13 pm #34685Hi,
Thanks for the help!! Sorry to ask what may seem a silly basic question, but if my arrya is setup by:
$dataPoints[] = array(“x” => (strtotime($row[0])*1000), “y” => $row[1]*1 );
Is there an easy way to turn this into having the current X Axis as a Label?
Thanks,
Mike
June 21, 2021 at 7:59 pm #34695Mike,
You can format the date time in php using date function and pass it as label as shown in this code snippet
$dataPoints[] = array("label" => date("d-m-Y H:i:s",strtotime($row[0])), "y" => $row[1]*1);—-
Manoj Mohan
Team CanvasJS -
This reply was modified 5 years ago by
You must be logged in to reply to this topic.