Chris,
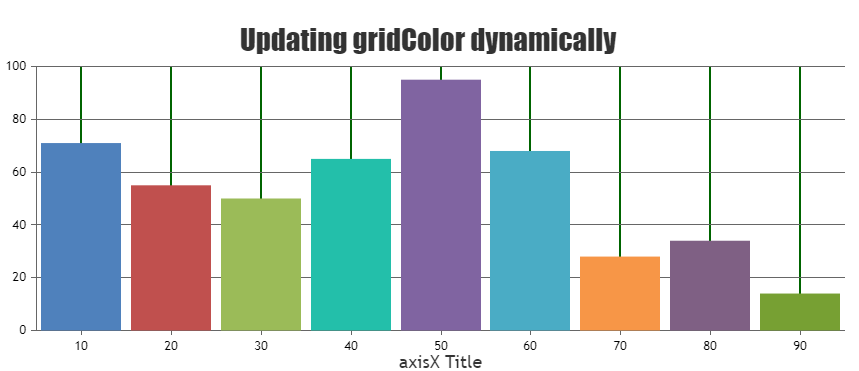
To dynamically update the gridColor please set the gridThickness and gridColor by updating chart options then call the render() as shown in the code snippet below –
chart.options.axisX.gridThickness = 2;
chart.options.axisX.gridColor = "#006400";

chart.render();
To update any axis elements dynamically you can also use the set().
Please take a look at this JSFiddle for a working example on updating the gridColor.
If you are still facing issue, kindly create a JSFiddle with your use-case and share it with us so that we can look into the code & the chart-options, understand the scenario better and help you out.
___________
Indranil Deo
Team CanvasJS
.