Home Forums StockChart Support dynamic charts no longer working since 1.6.2

dynamic charts no longer working since 1.6.2

Viewing 4 posts - 1 through 4 (of 4 total)
  • #37640

    I previously submitted a support request to fix an issue with the slider that was introduced somewhere between 1.5.1 and 1.6.1. The associated fiddle was: https://jsfiddle.net/jcmalek/6tfac1x0/24/.

    You released a fix for this very quickly (thank you)! :)

    However, it appears that now that dynamic charts are completely not working as of 1.6.2.

    Please see the same previous fiddle: https://jsfiddle.net/jcmalek/6tfac1x0/24/.

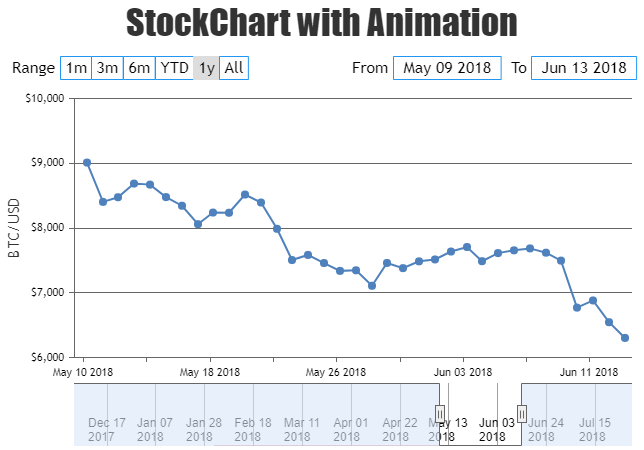
    As you adjust the navigator, the data should load in dynamically. This part of things was working when I originally submitted the fiddle. (The problem was only the slider at the time). However, nothing is happening anymore. All of this was working back in CanvasJS 1.5.1 (slider and dynamic charts). I am currently still using version 1.5.1 until these bugs are fixed and I can upgrade.

    Just for convenience, the dynamic charts documentation:
    https://canvasjs.com/docs/charts/how-to/creating-dynamic-charts/
    #37653

    @scroteau,

    You can update the dataPoints using set method like stockChart.charts[0].data[0].set("dataPoints", subsetDataPoints)or update the stockchart options like stockChart.options.charts[0].data[0].dataPoints = subsetDataPoints. Please take a look at this updated JSFiddle for sample code.

    Dynamically updating datapoints of Stockchart on rangeChanged

    —-
    Manoj Mohan
    Team CanvasJS

    #37682

    Ok. Thanks. I guess something in the implementation changed since the code was working previously. I’ll switch to the other methods you suggested and upgrade to the latest stockcharts.

    #37690

    The latest version is working for me thanks. Guess it was something mainly in the fiddle.

Viewing 4 posts - 1 through 4 (of 4 total)

You must be logged in to reply to this topic.