Home Forums Chart Support Dynamic Chart to display Current Sensor Data

Dynamic Chart to display Current Sensor Data

Viewing 2 posts - 1 through 2 (of 2 total)
  • #44047

    I want to create a dynamic line chart for my Angular Web Application which will show timestamp on the x-axis and current sensor data on the y-axis. The data is updated every 1 second. How do I do this using CanvasJS?

    #44049

    @anirudhspriyan,

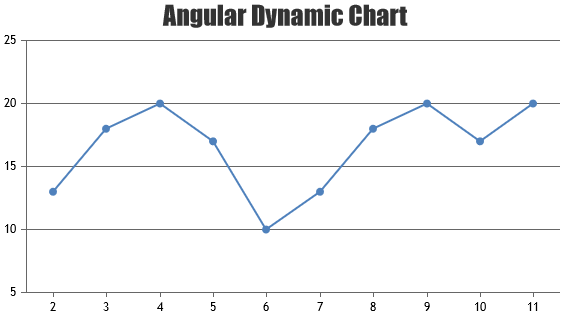
    Please take a look at this gallery page for an example of a dynamic chart that updates every 1 second, created in Angular. This example uses random data, however, you can pass sensor data to the chart every 1 second to achieve your requirement.

    Angular Dynamic Chart


    Thangaraj Raman
    Team CanvasJS

Viewing 2 posts - 1 through 2 (of 2 total)

You must be logged in to reply to this topic.