Login to Ask a Question or Reply
You must be logged in to post your query.
Home › Forums › Chart Support › Drawing defined horizontal lines
Drawing defined horizontal lines
- This topic has 8 replies, 2 voices, and was last updated 4 years, 3 months ago by
Manoj Mohan.
Tagged: axisY, striplines, zooming
-
March 21, 2022 at 11:17 pm #37200
I’m currently testing out the demo version right now and would like to know if its possible to add axisY striplines that have an x axis start and end point that are just lines and not windows. An alternative would is there a way for me to add them as a data series but not impact the zooming? So in short I would like the ability to draw horizontal bounds that dont span the entire width of the graph and dont impact zooming on the main series.
-
This topic was modified 4 years, 4 months ago by
Tbates. Reason: more information/clearer
March 23, 2022 at 6:55 pm #37217We would like to use your product but this is an important thing to know. Any insight would be appreciated.
March 23, 2022 at 7:40 pm #37218The striplines are drawn from left to right of plotarea in case of axisY and top to bottom of plotarea in case of axisX.
Can you kindly create a JSFiddle with your scenario and share it with us along with pictorial representation so that we can understand your requirement better and suggest you a possible solution?
—-
Manoj Mohan
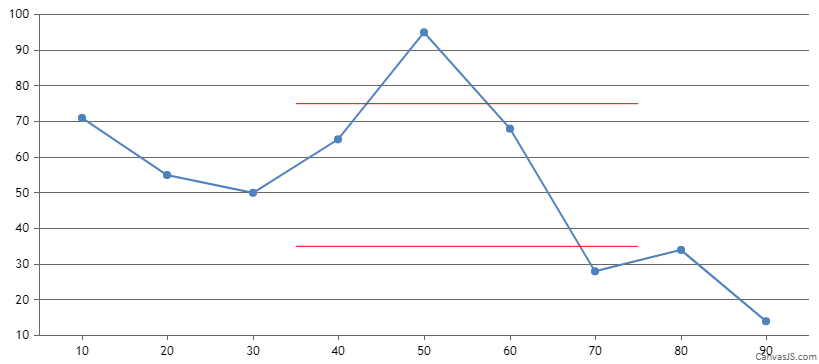
Team CanvasJSMarch 23, 2022 at 8:35 pm #37223I would like to draw striplines like the purple dashed ones from a start point to an end point.
In this current example I have them drawn as their own data series which causes them to impact how zooming works, which I do not want.
If I draw them as striplines they span the entire width of the graph which I do not want either. Is there any solution to this?March 25, 2022 at 9:35 pm #37247You can draw additional lines as per your requirement using context of canvas as shown in this code snippet.
function calculateValuesInPixel(){
  for(var i = 0; i < points.length; i++){
    valuesInPixel[i].x1 = chart.axisX[0].convertValueToPixel(points[i].x1);
    valuesInPixel[i].x2 = chart.axisX[0].convertValueToPixel(points[i].x2);
    valuesInPixel[i].y = chart.axisY[0].convertValueToPixel(points[i].y);
  }
}

function drawHorizontalLines(){
  for(var i = 0; i < valuesInPixel.length; i++){
    chart.ctx.beginPath();
    chart.ctx.moveTo(valuesInPixel[i].x1, valuesInPixel[i].y);
    chart.ctx.lineTo(valuesInPixel[i].x2, valuesInPixel[i].y);
    chart.ctx.strokeStyle = "#FF0000";

    chart.ctx.stroke();
  }
}
Please take a look at this JSFiddle for complete working code.
—-
Manoj Mohan
Team CanvasJSMarch 26, 2022 at 1:35 am #37249I’m currently using the CanvasJS react component. I tried to add the code from the JSFiddle into the the componentDidMount life cycle method after this.chart.render() is called. It’s not working as expected. When I debug right after this call the horizontal lines that I just drew on the canvas are visible but the actual data series is not yet. Then the data series is drawn and the the horizontal lines disappear. What am I missing? is the canvas cleared asynchronously when drawing the dataseries?
March 29, 2022 at 5:04 pm #37273You can achieve similar result in React by adding methods
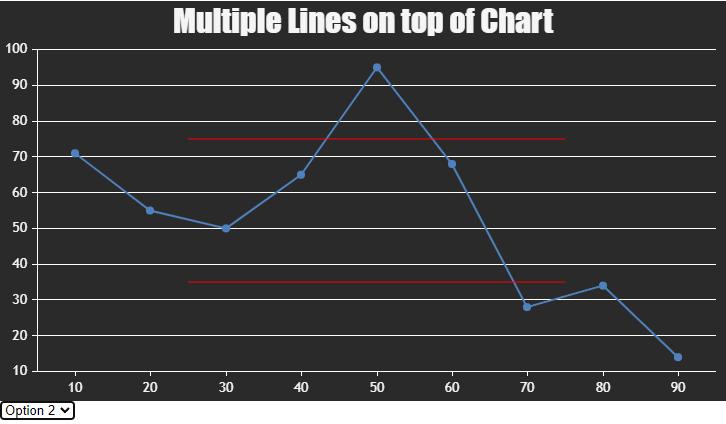
calculateValuesInPixelanddrawHorizontalLinesin component and call respective methods in the ComponentDidMount lifecycle method as shown in the below code snippet.class App extends Component { constructor(props) { super(props); this.points = [ { x1: 35, x2: 75, y: 75}, //line 1 { x1: 35, x2: 75, y: 35} //line 2 ]; this.valuesInPixel = [ { x1: null, x2: null, y: null}, //line 1 { x1: null, x2: null, y: null} //line 2 ]; } calculateValuesInPixel = () => { for(var i = 0; i < this.points.length; i++) { this.valuesInPixel[i].x1 = this.chart.axisX[0].convertValueToPixel(this.points[i].x1); this.valuesInPixel[i].x2 = this.chart.axisX[0].convertValueToPixel(this.points[i].x2); this.valuesInPixel[i].y = this.chart.axisY[0].convertValueToPixel(this.points[i].y); } } drawHorizontalLines = () => { for(var i = 0; i < this.valuesInPixel.length; i++) { this.chart.ctx.beginPath(); this.chart.ctx.moveTo(this.valuesInPixel[i].x1, this.valuesInPixel[i].y); this.chart.ctx.lineTo(this.valuesInPixel[i].x2, this.valuesInPixel[i].y); this.chart.ctx.strokeStyle = "#FF0000"; this.chart.ctx.stroke(); } } componentDidMount() { this.calculateValuesInPixel(); this.drawHorizontalLines(); window.addEventListener('resize', this.drawHorizontalLines ); } componentDidUnMount() { window.removeEventListener('resize', this.drawHorizontalLines ); } . . . }Please check out this StackBlitz example for complete working code.
—-
Manoj Mohan
Team CanvasJSApril 4, 2022 at 9:16 pm #37316I appreciate your help up to this point! I just have a couple more questions regarding the horizontal lines. Your solution helped and I was almost able to get our desired behavior!
1.) We aren’t just using one graph. We are fetching the data for multiple graphs from our back end and want to cycle through them. In our playground app I’m using a single canvasJS component and passing a new set of graph options on state change. The problem is this does not redraw these horizontal lines when I toggle to the next graph(new options are set). Additionally, if I change the size of the browser window, open the inspect tab, or just toggle the zoom button in the toolbar(to the traverse curve option) the horizontal lines we drew disappear. How can I fix this behavior?
2) Ideally we would like the annotations to be entirely handled by CanvasJS. If we move forward and make a purchase, would it be possible to add x axes start and end points for Y axes striplines to the library?
April 7, 2022 at 7:07 pm #37353The problem is this does not redraw these horizontal lines when I toggle to the next graph(new options are set). Additionally, if I change the size of the browser window, open the inspect tab, or just toggle the zoom button in the toolbar(to the traverse curve option) the horizontal lines we drew disappear. How can I fix this behavior?
You can modify the react chart component to accept a function to redraw the line as prop which will be called whenever the chart options is changed. Also, in order to redraw the lines on toggling the zoom button and on resizing the browser window, you need to add a click event listener to the zoom button and resize event listener on window. Please take a look below for the code snippet on the same.
.
.
.
componentDidMount() {
    if(typeof this.chart !== "undefined") {
      this.calculateValuesInPixel(this.chart);
      this.drawHorizontalLines(this.chart);
      this.chart.container.querySelector(".canvasjs-chart-toolbar button:first-child").addEventListener('click', this.redrawLines)
      window.addEventListener('resize', this.redrawLines );
    }
	}

  componentDidUnMount() {
    window.removeEventListener('resize', this.redrawLines );
  }

  selectChange = (e) => {
    this.setState({optionIndex: e.target.value})
  }

  onChartUpdate = () => {
    this.calculateValuesInPixel(this.chart);
    this.drawHorizontalLines(this.chart);
  }
.
.
.
Please check out this Stackblitz project for an example on drawing lines on chart and rendering it based on chart options selected from dropdown.
2) Ideally we would like the annotations to be entirely handled by CanvasJS. If we move forward and make a purchase, would it be possible to add x axes start and end points for Y axes striplines to the library?
It is not possible to add notation as an inbuilt feature as of now. On purchasing the developer license, you get the access for source code which you can modify as per your requirement.
—-
Manoj Mohan
Team CanvasJS -
This topic was modified 4 years, 4 months ago by
Tagged: axisY, striplines, zooming
You must be logged in to reply to this topic.