Login to Ask a Question or Reply
You must be logged in to post your query.
Home › Forums › Chart Support › dateTime stamp time zone
dateTime stamp time zone
- This topic has 14 replies, 7 voices, and was last updated 1 year, 1 month ago by
Manoj Mohan.
-
January 27, 2021 at 8:53 am #32611
Hello, following the instructions on https://canvasjs.com/docs/charts/basics-of-creating-html5-chart/date-time-axis/
I have datapoints that use a dateTime stamp in milliseconds in UTC. But when I put them into the chart, it comes out as my local time zone along the x-axis. How can I set it so the x-axis stays as UTC?
Example: https://jsfiddle.net/h1movjbe/
January 27, 2021 at 11:46 pm #32627You can use toUTCString() method to convert a Javascript timestamp values into UTC format. Please refer to this stack overflow article for more information.
Also if you like to display time in a particular timezone, you can use the toLocaleString() method to convert a Date object to a string, using locale settings. You can output dates that are in UTC or local time to a specific timezone by passing timeZone option to toLocaleString().
—
Shashi Ranjan
Team CanvasJSJanuary 28, 2021 at 12:58 am #32628Hello, can you give an example based on my jsfiddle?
I tried applying toUTCString to the x datapoints and it didn’t work. For example, in a datapoint pair, “x”: (new Date(1601006400003)).toUTCString() didn’t output anything.
January 28, 2021 at 9:23 am #32630I think I was able to get what I wanted by using labelFormatter and combining it with toLocaleString. Updated example: https://jsfiddle.net/h1movjbe/1/
January 28, 2021 at 7:41 pm #32636Glad it worked for you. :)
You can further improve the solution by formatting the date and time values in toolTip using the contentFormatter, please take a look at this updated JSFiddle for an example on the same.
—
Shashi Ranjan
Team CanvasJSFebruary 5, 2021 at 2:40 am #32702Hello, I have interval set to 1 day, but the tick marks still have an interval of every local day instead of UTC day. How can I change the interval tick to occur on every UTC midnight?
February 5, 2021 at 11:14 pm #32707Displaying labels at a specific position(say every midnight) on the axes depends upon the very first label that is rendered, subsequent labels are just rendered at a defined interval(auto-calculated/user-defined) from there. As of now, we do not have control over the starting label on the axes and so it is not possible to achieve the above requirement.
—
Shashi Ranjan
Team CanvasJSMarch 4, 2021 at 2:32 pm #32968Hello, this is joshuasosa’s project lead. If we set the timezone of the client computer to UTC then the plots display the way we want, with the 1 day interval labels marked at midnight UTC. Can we tell canvasJS to use a specific timezone instead of the client computer’s timezone? Thanks.
March 8, 2021 at 11:28 pm #33053JavaScript’s Date object tracks time in UTC internally, but typically accepts input and produces output in the local time of the system it’s running on. As you are looking to display time in a particular timezone, you can use the toLocaleString() method to convert a Date object to a string, using locale settings. You can output dates that are in UTC or local time to a specific timezone by passing timeZone option to toLocaleString() and its variations. For example:
var dateTime = new Date("2021-03-09T00:00:00.000+08:00");
dateTime.toLocaleString('en-US', { timeZone: 'America/New_York' })
//=> "3/8/2021, 11:00:00 AM"
// (midnight in China on March 9th is 11:00 AM in New York on March 8th)
You can also refer to this Stack Overflow thread for more information on initializing JavaScript date object to a particular timezone.
—
Shashi Ranjan
Team CanvasJSMarch 9, 2021 at 2:04 am #33054That’s what we currently use for the label and tooltip, but the interval on the plot doesn’t change to UTC when it’s set to 1-day intervals.
March 15, 2021 at 6:24 pm #33247When we use the x-values for dataPoint, axis Labels are not shown for dataPoint but at every interval of the axis. As you are looking to display axis label at specified dataPoint value using label property in dataPoint along with the x-value should work fine.
To achieve this, you can pass a custom attribute(for example,
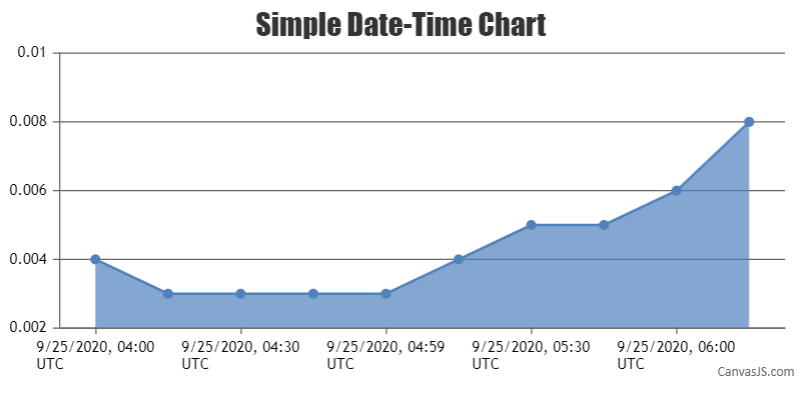
"time") that will store timestamp values to each dataPoint object. The initial options to dataPoints array will be like:[ { "time": 1601006400003, "y": 0.004 }, { "time": 1601007299997, "y": 0.003 }, { "time": 1601008200000, "y": 0.003 } ]Just before rendering the chart, we will add the label property with timestamp value converted to UTC and x-value with average offset value between subsequent timestamps(x-values are used here for setting interval). Below is the code snippet for achieving the same:
let date = new Date(dataPoints[i].time);
dataPoints[i].label = date.toLocaleDateString("en-US", localeOptions);
dataPoints[i].x = i * 15; //15 minutes is average difference between timestamp values
You can also refer to this update JSFiddle for a working example with sample code.
—
Shashi Ranjan
Team CanvasJSSeptember 14, 2021 at 7:59 am #35708I think manually add time zone offset to “x” value is very inconvenient. It would be great that we can set timeZone of timeZoneOffset to canvasjs as an option that it can automatically reflects it to the x axis labels.
See corresponding option in highchart https://api.highcharts.com/highcharts/time
September 16, 2021 at 7:34 pm #35751Thanks for your suggestion. We will look into this feature in our future versions.
—
Ranjitha R
Team CanvasJSJune 30, 2025 at 4:31 pm #61167is it now possible to do this?
June 30, 2025 at 5:59 pm #61170Sorry, this feature is not available as an in-built feature for now.
—-
Manoj Mohan
Team CanvasJS
You must be logged in to reply to this topic.