Login to Ask a Question or Reply
You must be logged in to post your query.
Home › Forums › Report Bugs › Date displaying 1 month
Date displaying 1 month
- This topic has 1 reply, 2 voices, and was last updated 8 years, 2 months ago by
Vishwas R.
-
April 24, 2018 at 8:17 am #20441
Hello,
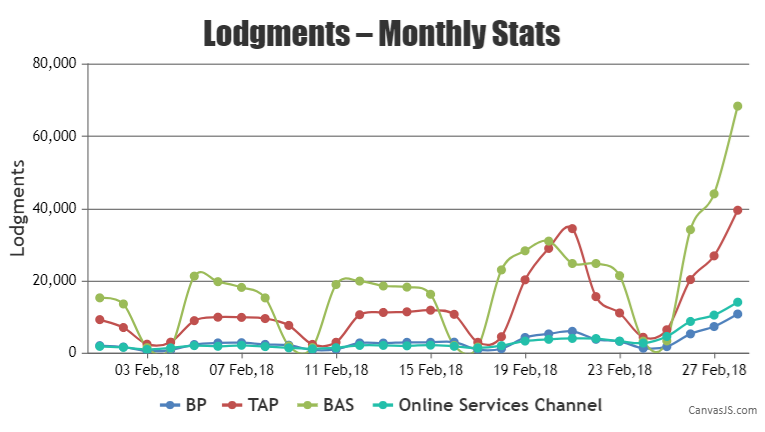
I recently purchased the Developers licence of CanvasJS Charts. Am trying to determine why the date is displayed 1 month in advance. It happens in all pages.
Is there a figure I need to change with the CanvasJS.js file?
Thankyou in advance.
Warren Faulkner
<!DOCTYPE HTML>
<html>
<head>
<meta charset="utf-8">
<link rel="stylesheet" href="https://fonts.googleapis.com/css?family=Bitter:400,700" type="text/css">
<meta charset="UTF-8">
<meta name="viewport" content="device-width, initial-scale=1">
<link rel="stylesheet" href="../css/bootstrap.min.css">
<link rel="stylesheet" href="../css/bootstrap.css">
<link rel="stylesheet" href="../css/custom.css">
<link rel="stylesheet" href="../css/form_style.css">
<link rel="stylesheet" href="../css/expand_collapse.css">
<link rel="stylesheet" href="../css/eoc_tabs_style.css">
<link rel="stylesheet" href="https://maxcdn.bootstrapcdn.com/bootstrap/3.3.7/css/bootstrap.min.css">
<script src="https://ajax.googleapis.com/ajax/libs/jquery/3.3.1/jquery.min.js"></script>
<script src="https://maxcdn.bootstrapcdn.com/bootstrap/3.3.7/js/bootstrap.min.js"></script>
<script src="../scripts/jquery.js" type="text/javascript"></script>
<script src="../scripts/js-script.js" type="text/javascript"></script>
<title>Production Control | Lodgments-Monthly</title>
<!–The following script tag downloads a font from the Adobe Edge Web Fonts server for use within the web page. We recommend that you do not modify it.–>
<script>var __adobewebfontsappname__="dreamweaver"</script>
<script src="http://use.edgefonts.net/bitter:n7,n4,i4:default.js" type="text/javascript"></script>
<script>
window.onload = function () {var chart21 = new CanvasJS.Chart("chart21Container", {
animationEnabled: true,
title:{
text: "Lodgments – Monthly Stats"
},
axisX: {
valueFormatString: "DD MMM,YY"
},
axisY: {
title: "Lodgments",
includeZero: false,
suffix: ""
},
legend:{
cursor: "pointer",
fontSize: 16,
itemclick: toggleDataSeries
},
toolTip:{
shared: true
},
data: [{
name: "BP",
type: "spline",
yValueFormatString: "#,###,###",
showInLegend: true,
dataPoints: [
{ x: new Date(2018,2,1), y: 2127 },
{ x: new Date(2018,2,2), y: 1745 },
{ x: new Date(2018,2,3), y: 641 },
{ x: new Date(2018,2,4), y: 904 },
{ x: new Date(2018,2,5), y: 2425 },
{ x: new Date(2018,2,6), y: 2876 },
{ x: new Date(2018,2,7), y: 2933 },
{ x: new Date(2018,2,8), y: 2467 },
{ x: new Date(2018,2,9), y: 2250 },
{ x: new Date(2018,2,10), y: 928 },
{ x: new Date(2018,2,11), y: 1116 },
{ x: new Date(2018,2,12), y: 2869 },
{ x: new Date(2018,2,13), y: 2838 },
{ x: new Date(2018,2,14), y: 3039 },
{ x: new Date(2018,2,15), y: 3044 },
{ x: new Date(2018,2,16), y: 3082 },
{ x: new Date(2018,2,17), y: 1014 },
{ x: new Date(2018,2,18), y: 1270 },
{ x: new Date(2018,2,19), y: 4383 },
{ x: new Date(2018,2,20), y: 5364 },
{ x: new Date(2018,2,21), y: 6082 },
{ x: new Date(2018,2,22), y: 3884 },
{ x: new Date(2018,2,23), y: 3313 },
{ x: new Date(2018,2,24), y: 1423 },
{ x: new Date(2018,2,25), y: 1853 },
{ x: new Date(2018,2,26), y: 5376 },
{ x: new Date(2018,2,27), y: 7405 },
{ x: new Date(2018,2,28), y: 10872 }
]
},
{
name: "TAP",
type: "spline",
yValueFormatString: "#,###,####",
showInLegend: true,
dataPoints: [
{ x: new Date(2018,2,1), y: 9322 },
{ x: new Date(2018,2,2), y: 7132 },
{ x: new Date(2018,2,3), y: 2522 },
{ x: new Date(2018,2,4), y: 3082 },
{ x: new Date(2018,2,5), y: 9032 },
{ x: new Date(2018,2,6), y: 9997 },
{ x: new Date(2018,2,7), y: 9940 },
{ x: new Date(2018,2,8), y: 9615 },
{ x: new Date(2018,2,9), y: 7721 },
{ x: new Date(2018,2,10), y: 2467 },
{ x: new Date(2018,2,11), y: 3050 },
{ x: new Date(2018,2,12), y: 10678 },
{ x: new Date(2018,2,13), y: 11301 },
{ x: new Date(2018,2,14), y: 11478 },
{ x: new Date(2018,2,15), y: 11931 },
{ x: new Date(2018,2,16), y: 10786 },
{ x: new Date(2018,2,17), y: 3045 },
{ x: new Date(2018,2,18), y: 4592 },
{ x: new Date(2018,2,19), y: 20332 },
{ x: new Date(2018,2,20), y: 29025 },
{ x: new Date(2018,2,21), y: 34499 },
{ x: new Date(2018,2,22), y: 15683 },
{ x: new Date(2018,2,23), y: 11158 },
{ x: new Date(2018,2,24), y: 4427 },
{ x: new Date(2018,2,25), y: 6518 },
{ x: new Date(2018,2,26), y: 20390 },
{ x: new Date(2018,2,27), y: 26962 },
{ x: new Date(2018,2,28), y: 39590 }
]
},
{
name: "BAS",
type: "spline",
yValueFormatString: "#,###,###",
showInLegend: true,
dataPoints: [
{ x: new Date(2018,2,1), y: 15345 },
{ x: new Date(2018,2,2), y: 13652 },
{ x: new Date(2018,2,3), y: 1564 },
{ x: new Date(2018,2,4), y: 1412 },
{ x: new Date(2018,2,5), y: 21348 },
{ x: new Date(2018,2,6), y: 19820 },
{ x: new Date(2018,2,7), y: 18237 },
{ x: new Date(2018,2,8), y: 15334 },
{ x: new Date(2018,2,9), y: 2071 },
{ x: new Date(2018,2,10), y: 1586 },
{ x: new Date(2018,2,11), y: 19028 },
{ x: new Date(2018,2,12), y: 19982 },
{ x: new Date(2018,2,13), y: 18627 },
{ x: new Date(2018,2,14), y: 18315 },
{ x: new Date(2018,2,15), y: 16331 },
{ x: new Date(2018,2,16), y: 2164 },
{ x: new Date(2018,2,17), y: 1721 },
{ x: new Date(2018,2,18), y: 23076 },
{ x: new Date(2018,2,19), y: 28366 },
{ x: new Date(2018,2,20), y: 31042 },
{ x: new Date(2018,2,21), y: 24849 },
{ x: new Date(2018,2,22), y: 24849 },
{ x: new Date(2018,2,23), y: 21479 },
{ x: new Date(2018,2,24), y: 3367 },
{ x: new Date(2018,2,25), y: 3429 },
{ x: new Date(2018,2,26), y: 34211 },
{ x: new Date(2018,2,27), y: 44119 },
{ x: new Date(2018,2,28), y: 68398 }
]
},
{
name: "Online Services Channel",
type: "spline",
yValueFormatString: "#,###,###",
showInLegend: true,
dataPoints: [
{ x: new Date(2018,2,1), y: 1920 },
{ x: new Date(2018,2,2), y: 1653 },
{ x: new Date(2018,2,3), y: 1053 },
{ x: new Date(2018,2,4), y: 1491 },
{ x: new Date(2018,2,5), y: 2129 },
{ x: new Date(2018,2,6), y: 1943 },
{ x: new Date(2018,2,7), y: 2225 },
{ x: new Date(2018,2,8), y: 1862 },
{ x: new Date(2018,2,9), y: 1507},
{ x: new Date(2018,2,10), y: 1234 },
{ x: new Date(2018,2,11), y: 1550 },
{ x: new Date(2018,2,12), y: 2188 },
{ x: new Date(2018,2,13), y: 2195 },
{ x: new Date(2018,2,14), y: 2073 },
{ x: new Date(2018,2,15), y: 2263 },
{ x: new Date(2018,2,16), y: 1946 },
{ x: new Date(2018,2,17), y: 1485 },
{ x: new Date(2018,2,18), y: 2111 },
{ x: new Date(2018,2,19), y: 3391 },
{ x: new Date(2018,2,20), y: 3872 },
{ x: new Date(2018,2,21), y: 4120 },
{ x: new Date(2018,2,22), y: 4082 },
{ x: new Date(2018,2,23), y: 3375 },
{ x: new Date(2018,2,24), y: 2826 },
{ x: new Date(2018,2,25), y: 4665 },
{ x: new Date(2018,2,26), y: 8815 },
{ x: new Date(2018,2,27), y: 10574 },
{ x: new Date(2018,2,28), y: 14146 }
]
}]
});
chart21.render();function toggleDataSeries(e){
if (typeof(e.dataSeries.visible) === "undefined" || e.dataSeries.visible) {
e.dataSeries.visible = false;
}
else{
e.dataSeries.visible = true;
}
chart21.render();
}}
</script>
</head>
<body><!– Fixed navbar –>
<nav class="navbar navbar-default navbar-fixed-top">
<div class="header">
<p id="date"></p>
<h1>Production Control</h1></div>
<div class="container">
<div class="navbar-header">
<button type="button" class="navbar-toggle collapsed" data-toggle="collapse" data-target="#navbar" aria-expanded="false" aria-controls="navbar">
<span class="sr-only">Toggle navigation</span>
<span class="icon-bar"></span>
<span class="icon-bar"></span>
<span class="icon-bar"></span>
</button>
</div>
<div id="navbar" class="collapse navbar-collapse">
<ul class="nav navbar-nav">
<li class="active"><a href="../pages/index.html">Home</a></li>
<li><a href="../pages/about.html">About Production Control</a></li>
<li class="dropdown">
<a href="#">Business Events<span class="caret"></span></a>
<ul class="dropdown-menu">
<li><a href="../pages/lodgments.html">Lodgments</a></li>
<li><a href="../pages/bulk_load.html">Bulk Load</a></li>
<li><a href="../pages/transactions.html">Transactions</a></li>
<li><a href="../pages/system_maintenance.html">System Maintenance</a></li>
<li><a href="../pages/senior_events.html">Senior_Events</a></li>
</ul>
</li>
<li class="dropdown">
<a href="#">Major Watch Items<span class="caret"></span></a>
<ul class="dropdown-menu">
<li><a href="../pages/system_performance.html">System Performance</a></li><li><a href="../pages/special_events.html">Special Events</a></li>
<li><a href="../pages/tps_projects.html">TPS Projects</a></li>
<li><a href="../pages/service_design.html">Service Design</a></li>
</ul>
</li>
<li class="dropdown">
<a href="#">Our Services<span class="caret"></span></a>
<ul class="dropdown-menu">
<li><a href="../pages/service_desk.html">Service Desk</a></li>
<li><a href="../pages/incident_mgt.html">Incident Mgt</a></li>
<li><a href="../pages/problem_mgt.html">Problem Mgt</a></li>
<li><a href="../pages/change_mgt.html">Change Mgt</a></li>
</ul>
</li>
<li class="dropdown">
<a href="#">Reports<span class="caret"></span></a>
<ul class="dropdown-menu">
<li><a href="../reports/ea_deployment_monthly_report.html">Change Mgt</a></li>
<li><a href="../reports/ea_deployment_quarterly_report.html">Release Mgt</a></li>
<li><a href="../reports/lodgments_weekly.html">Logments – Weekly Report</a></li>
<li><a href="../reports/lodgments_monthly.html">Lodgments – Monthly Report</a></li>
</ul>
</li>
</ul>
</div><!–/.nav-collapse –>
</div>
</nav><div class="container-fluid">
<br>
<br>
<br>
<br>
<br>
<br><!– Begin page content –>
<h1>Monthly Lodgments</h1>
<div id="Lodgments" class="tabcontent">
<h3>Lodment Data – Current Month</h3>
<div id="chart21Container" style="height: 370px; width: 100%;"></div>
</div>
</div>
<script src="../scripts/canvas.js/CanvasJS.js"></script>
<script>
var d = new Date();
document.getElementById("date").innerHTML = d.toDateString();
</script>
<script src="https://ajax.googleapis.com/ajax/libs/jquery/2.1.4/jquery.min.js"></script>
<script src="../scripts/bootstrap.min.js"></script>
<script src="../scripts/script.js"></script>
<script src="../js/expand_collapse.js"></script>
<script src="../js/eoc_tabs.js"></script></body>
</html>April 24, 2018 at 9:40 am #20442In JavaScript, date object can be created in 4 ways.
new Date(),new Date(year, month, day, hours, minutes, seconds, milliseconds),new Date(milliseconds),new Date(date string).In your case i.e
new Date(year, month, day), month counts from 0 to 11 i.e. 0 corresponds to January and 11 corresponds to December. Changing the month according to JavaScript date-object should work fine in your case.For different JavaScript date formats please refer this article.
Please take a look at this JSFiddle for a working example with sample code.
—
Vishwas R
Team CanvasJS
You must be logged in to reply to this topic.