Home Forums Chart Support datapoints not redering on chart through loop

datapoints not redering on chart through loop

Viewing 6 posts - 1 through 6 (of 6 total)
  • #14811

    Ali
    #14814

    @ali,

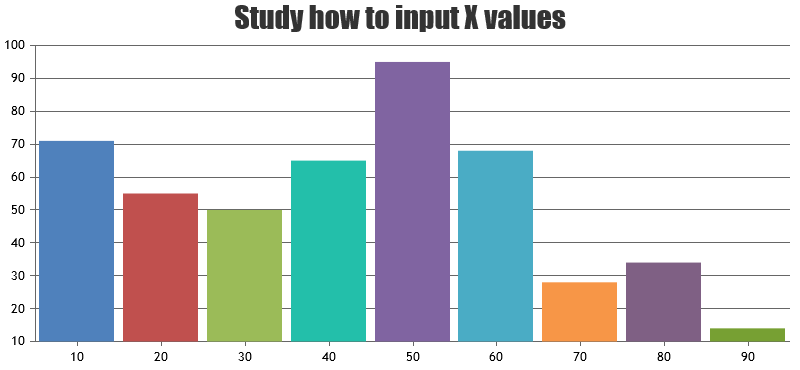
    x-Value can be numeric or a dateTime value. We observe that you are passing x-value as string, passing numeric or dateTime values will work fine.
    chart with x values


    Vishwas R
    Team CanvasJS

    #14839

    Ali

    Thanks dear got that point.

    How we can pass string data points then


    @Vishwas
    R

    #14851

    @Ali

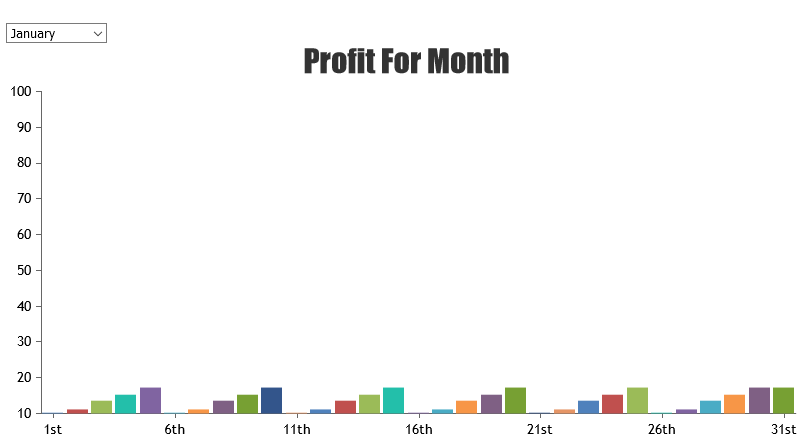
    Instead of using x, you can use label to pass the string. Please take a look at this updated JSFiddle.
    chart with data based on dropdown value

    —-
    Bivek Singh
    Team CanvasJS

    #15029

    van

    But if I pass it as label, how can I maintain the order like the following jsonarray?

    [{“score”:20,”time”:”2014,10,21,18,48,05″}, {“score”:30,”time”:”2014,10,21,18,47,51″}, {“score”:10,”time”:”2014,10,21,18,47,37″}, {“score”:0,”time”:”2014,10,21,18,47,06″}, {“score”:20,”time”:”2014,10,21,18,44,15″}]

    #15033

    @van,

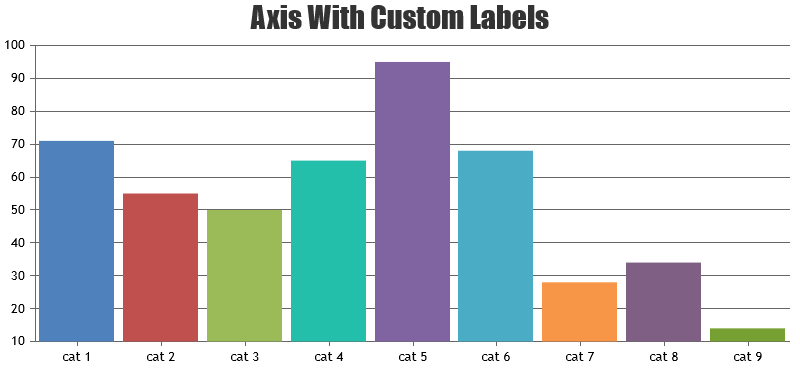
    Please have a look on this jsfiddle on Rendering Chart from JSON Data. Also kindly note that the dataPoints need to be in the format accepted by CanvasJS, before you pass them to Chart options. You can refer to this link for additional info on valid Date-Time formats.
    chart with custom labels on x axis

    ___
    Suyash Singh
    Team CanvasJS

Viewing 6 posts - 1 through 6 (of 6 total)

You must be logged in to reply to this topic.