@elanchezhiyan,
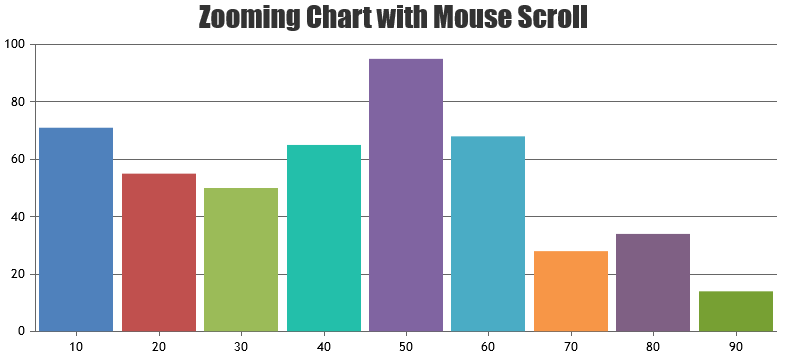
You can zoom the chart using mousewheel by attaching wheel event to the chart. Please find the code snippet below.
document.getElementsByClassName("canvasjs-chart-canvas")[1].addEventListener("wheel", function(e){
  e.preventDefault();

  if(e.clientX < chart.plotArea.x1 || e.clientX > chart.plotArea.x2 || e.clientY < chart.plotArea.y1 || e.clientY > chart.plotArea.y2)
  	return;

  var axisX = chart.axisX[0];
  var viewportMin = axisX.get("viewportMinimum"),
      viewportMax = axisX.get("viewportMaximum"),
      interval = axisX.get("minimum");

  var newViewportMin, newViewportMax;

  if (e.deltaY < 0) {
    newViewportMin = viewportMin + interval;
    newViewportMax = viewportMax - interval;
  }
  else if (e.deltaY > 0) {
    newViewportMin = viewportMin - interval;
    newViewportMax = viewportMax + interval;
  }

  if(newViewportMin >= chart.axisX[0].get("minimum") && newViewportMax <= chart.axisX[0].get("maximum") && (newViewportMax - newViewportMin) > (2 * interval)){
    chart.axisX[0].set("viewportMinimum", newViewportMin, false);
    chart.axisX[0].set("viewportMaximum", newViewportMax);
  }

});
Please take a look at this JSFiddle for a working example.
—
Thangaraj Raman
Team CanvasJS
.