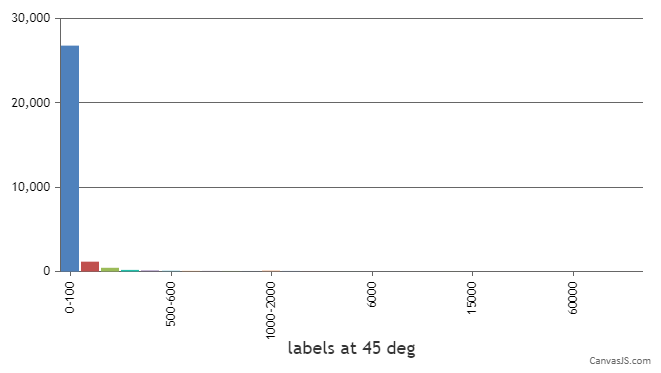
The data points below do not seem to work, please see https://jsfiddle.net/7rukabex/
{x: 0, y: 26784, label: ‘0’},
{x: 100, y: 1166, label: ‘100’},
{x: 200, y: 440, label: ‘200’},
{x: 300, y: 190, label: ‘300’},
{x: 400, y: 115, label: ‘400’},
{x: 500, y: 82, label: ‘500’},
{x: 600, y: 56, label: ‘600’},
{x: 700, y: 48, label: ‘700’},
{x: 800, y: 32, label: ‘800’},
{x: 900, y: 24, label: ‘900’},
{x: 1000, y: 99, label: ‘1000’},
{x: 2000, y: 39, label: ‘2000’},
{x: 3000, y: 14, label: ‘3000’},
{x: 4000, y: 4, label: ‘4000’},
{x: 5000, y: 5, label: ‘5000’},
{x: 6000, y: 7, label: ‘6000’},
{x: 7000, y: 5, label: ‘7000’},
{x: 8000, y: 3, label: ‘8000’},
{x: 9000, y: 3, label: ‘9000’},
{x: 10000, y: 8, label: ‘10000’},
{x: 15000, y: 4, label: ‘15000’},
{x: 20000, y: 1, label: ‘20000’},
{x: 25000, y: 1, label: ‘25000’},
{x: 30000, y: 2, label: ‘30000’},
{x: 50000, y: 0, label: ‘50000’},
{x: 60000, y: 0, label: ‘60000’},
{x: 70000, y: 0, label: ‘70000’},
{x: 80000, y: 0, label: ‘80000’},
{x: 90000, y: 1, label: ‘90000’}
How would I go about creating a chart like this”

.