Home Forums Chart Support Click event on whole chart area

Click event on whole chart area

Viewing 6 posts - 1 through 6 (of 6 total)
  • #39023

    I want to handle click events not only when I click precisely on a small point, but also when I click on another area of the chart. Sometimes it can be too difficult to click exactly on a point… How can I do this?

    Chart

    #39030

    Is it possible to do it in React with functional component?

    #39034

    @reactdeveloper,

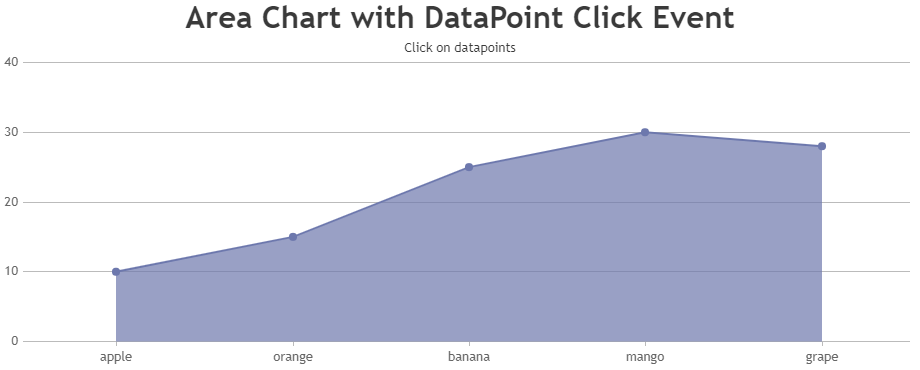
    To show datapoint information on clicking part of area chart as well, you can bind a click event on chart container and with the help of tooltip updated event, you can display the information about datapoint when clicked. Please take at the below code snippet for the same.

    
    let currentViewedDps = [];
    .
    toolTip: {
      updated: function (e) {
        currentViewedDps = [];
        e.entries.forEach((entry) => {
          currentViewedDps.push(entry.dataPoint);
        });
      },
        hidden: function (e) {
          currentViewedDps = [];
        },
    }
    .
    .
    useEffect(() => {
      if (chart != null) {
        chart.container.addEventListener('click', handleClick);
        return function () {
          chart.container.removeEventListener('click', handleClick);
        };
      }
    });
    .
    .

    Also, check out this StackBlitz project for complete code.

    Area chart with Datapoint click event

    —-
    Manoj Mohan
    Team CanvasJS

    #39037

    Big thanks! But one small problem. This click event also affected onresize event (my chart have zoom and panning), how to prevent it on resize?

    #39039

    @manoj-mohan

    It doesn’t work after the resize event, because the chart is redrawn and here’s the point in the UseEffect (chart == null) condition and addEventListener is not set.

    #39055

    @reactdeveloper,

    You can set a flag on rangeChanging and rangeChanged event handler and check the flag before executing the functionality of click event handler as shown in the code snippet below.

    
    let chartRangeChanging = false
    .
    .
    rangeChanging: () => { chartRangeChanging = true },
    rangeChanged: () => { chartRangeChanging = false },
    .
    .
    function handleClick() {
      if (currentViewedDps.length != 0 && !chartRangeChanging)
        alert(
          'DataPoint with { label: ' +
          currentViewedDps[0].label +
          ', y: ' +
          currentViewedDps[0].y +
          '} is clicked'
        );
    }
    .
    .
    

    Please take a look at this updated Stackblitz example for complete working code.

    —-
    Manoj Mohan
    Team CanvasJS

Viewing 6 posts - 1 through 6 (of 6 total)

You must be logged in to reply to this topic.