You must be logged in to post your query.
Home › Forums › Chart Support › Choose which line we need in front
Tagged: multiple line, visibile line, Y axis
Hi,
I have a chart with multiple y-axis. I will add multiple lines dynamically. Sometimes the data points for two chart lines are the same so they should be rendered in the same points and it will look like a single line. In this case, how can I choose which line shows over the other line? Basically, I want to achieve a CSS z-index thing in the chart lines.
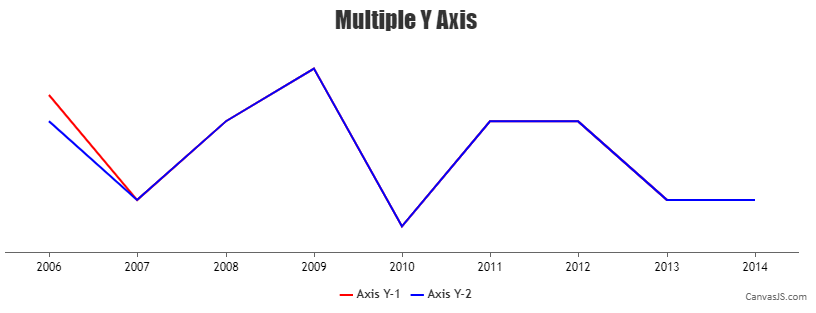
I have sample jsfiddle with two lines. I want to show the blue line over the red line. How can I achieve this? Is there any option in CavasJs to do this?
@ragu1991nathan,
Chart renders dataseries in the same sequence in which they are passed to the chart-options. Passing the dataseries with red color before the dataseries with blue color should work fine in your case. Please take a look at this updated JSFiddle for a working example.
— Thangaraj Raman Team CanvasJS
You must be logged in to reply to this topic. Login/Register