Login to Ask a Question or Reply
You must be logged in to post your query.
Home › Forums › Chart Support › Chart with Multiple Columns per Month
Chart with Multiple Columns per Month
- This topic has 9 replies, 2 voices, and was last updated 5 years, 3 months ago by
Azedinetaha.
Tagged: JSON Multiple columns
-
May 9, 2019 at 7:59 pm #25121
I want to create a column chart that will display work orders closed per month by technician. Each month would have up to 14 columns, one for each technician showing the total number of work orders they closed that month. How can I do this?
I am using SQL to create JSON files for the data. In production I would show three months at a time. Here’s a sample of my data for one month:
[
{“x”: “January”,”y”: 3,”label”: “Ben”},
{“x”: “January”,”y”: 2,”label”: “Bill”},
{“x”: “January”,”y”: 15,”label”: “Chris”},
{“x”: “January”,”y”: 20,”label”: “Jesse”},
{“x”: “January”,”y”: 11,”label”: “Josh”},
{“x”: “January”,”y”: 97,”label”: “Lilia”},
{“x”: “January”,”y”: 31,”label”: “Mariel”},
{“x”: “January”,”y”: 13,”label”: “Mike”},
{“x”: “January”,”y”: 75,”label”: “Rene”},
{“x”: “January”,”y”: 3,”label”: “Stephanie”},
{“x”: “January”,”y”: 34,”label”: “SteveD”},
{“x”: “January”,”y”: 73,”label”: “SteveR”},
{“x”: “January”,”y”: 78,”label”: “StevenM”},
]May 10, 2019 at 3:15 pm #25130You can use multiseries chart to fulfill your requirements. Please take a look at this JSFiddle.
—–
Manoj Mohan
Team CanvasJSMay 10, 2019 at 7:19 pm #25132Thank you. I would like to create one JSON file with all the data in it to create the chart you made. I’m having trouble getting it to work though. I can do it if I create an JSON file for each month but that is not ideal way to do it. Can I do it if my JSON file looks something like this?
[
{“label”: “Bill”,”month”: “January”,”y”: 11},
{“label”: “Chris”,”month”: “January”,”y”: 13},
{“label”: “Jesse”,”month”: “January”,”y”: 18},
{“label”: “Lilia”,,”month”: “January””y”: 65},
{“label”: “Bill”,”month”: “February”,”y”: 7},
{“label”: “Chris”,”month”: “February”,”y”: 56},
{“label”: “Jesse”,”month”: “February”,”y”: 32},
{“label”: “Lilia”,,”month”: “JFebruary””y”: 65}
]May 13, 2019 at 3:59 pm #25151You can keep just one JSON file. Parsing JSON data before passing it to chart options should work fine in this case. Please take a look at this JSFiddle.
——-
Manoj Mohan
Team CanvasJSMay 16, 2019 at 10:45 pm #25211Thanks! That’s exactly what I need but still run into a problem when I replace your code below:
var csvData = [
{ “label”: “Bill”, “month”: “January”, “y”: 11 },
{ “label”: “Chris”, “month”: “January”, “y”: 13 },
{ “label”: “Jesse”, “month”: “January”, “y”: 18 },
{ “label”: “Lilia”, “month”: “January”, “y”: 65 },
{ “label”: “Bill”, “month”: “February”, “y”: 7 },
{ “label”: “Chris”, “month”: “February”, “y”: 56 },
{ “label”: “Jesse”, “month”: “February”, “y”: 32 },
{ “label”: “Lilia”, “month”: “February”, “y”: 65 }
];with this
var csvData = [];
$.getJSON( “JSON/tcm/data.json”, function( data){
csvData = data;
});When I look at the console in Chrome I don’t see any errors but I get a blank chart.
May 17, 2019 at 5:26 pm #25223Parsing the JSON after the AJAX request should work fine in your case. Please take a look at this JSFiddle.
—–
Manoj Mohan
Team CanvasJSMay 17, 2019 at 8:02 pm #25224That works! Thanks so much for your help!
April 12, 2021 at 2:29 am #33932Hello @manoj-mohan
Thank you for your code but it give a probleme with this json data :
{ “label”: “Bill”, “month”: “January”, “y”: 11 },
{ “label”: “Chris”, “month”: “January”, “y”: 13 },
{ “label”: “Jesse”, “month”: “January”, “y”: 18 },
{ “label”: “Lilia”, “month”: “January”, “y”: 65 },
{ “label”: “Bill”, “month”: “February”, “y”: 7 },
{ “label”: “Chris”, “month”: “February”, “y”: 56 },
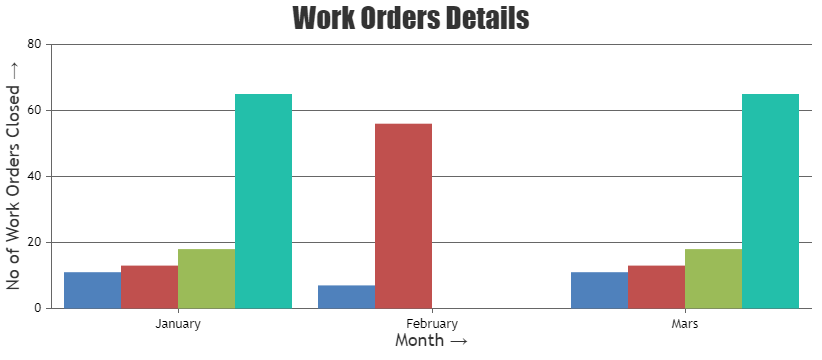
{ “label”: “Bill”, “month”: “Mars”, “y”: 11 },
{ “label”: “Chris”, “month”: “Mars”, “y”: 13 },
{ “label”: “Jesse”, “month”: “Mars”, “y”: 18 },
{ “label”: “Lilia”, “month”: “Mars”, “y”: 65 },data for mars its display in Febrary.
Can you have a look tks?
April 12, 2021 at 7:17 pm #33940You can categorize your data based on month and add an index for corresponding month to each datapoints. Please take a look at the code snippet below.
for(var i=0; i<csvData.length; i++) {
  var csvLines = csvData[i];
  if(!technicianData[csvLines.label]) {
    technicianData[csvLines.label] = [];
  }

  if(typeof months[csvLines.month] === "undefined") {
    months[csvLines.month] = monthIndex;
    monthIndex += 1;
  }
  technicianData[csvLines.label].push({ "label" : csvLines.month, y: csvLines.y, x: months[csvLines.month]});
}

var data = [];

for (var technician in technicianData ) {
  if (!technicianData.hasOwnProperty(technician)) continue;
  data.push({"name": technician, dataPoints: technicianData[technician]})
}
Also, check out this JSFiddle for complete working code.
—-
Manoj Mohan
Team CanvasJSApril 12, 2021 at 9:01 pm #33945Thank you very much for ur quickly answer
Tagged: JSON Multiple columns
You must be logged in to reply to this topic.