Login to Ask a Question or Reply
You must be logged in to post your query.
Home › Forums › Chart Support › Chart not rendering dynamically
Chart not rendering dynamically
- This topic has 3 replies, 2 voices, and was last updated 5 years, 2 months ago by
Vishwas R.
Tagged: dynamic chart
-
April 21, 2021 at 11:05 pm #34057
Hi, I have the following code whose intention is to do some sort of sorting. If I debug, I see that the content of the dataPoints are getting swapped inside the bubble sort method. But they chart.render() is not drawing the chart. Can you please tell me what I am missing.
Thanks,
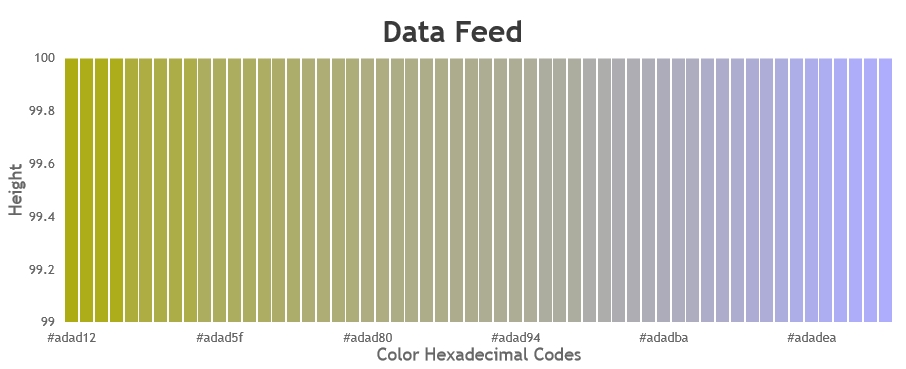
Pavan.var dataPoints = []; var indexLabels = ["High", "Low", "Medium"]; var colors = []; var labels = ["Jan", " ", " ", "Feb", " ", " ", "March", " ", " ", " "]; var rgbToHex = function (rgb) { var hex = Number(rgb).toString(16); if (hex.length < 2) { hex = "0" + hex; } return hex; }; function sleepFor( sleepDuration ){ var now = new Date().getTime(); while(new Date().getTime() < now + sleepDuration){ /* do nothing */ } } // Use the entire 256 colors for our sorting visualization for (var i = 0; i < 56; i++) { // Get a random number between 0 and 255. var randomNumber1 = Math.floor( Math.random() * 256 ); var randomNumber2 = Math.floor( Math.random() * 256 ); var randomNumber3 = Math.floor( Math.random() * 256 ); // var colorHexCode = "#" + rgbToHex(randomNumber1) + rgbToHex(randomNumber2) + rgbToHex(randomNumber3); var colorHexCode = "#adad" + rgbToHex(randomNumber1); dataPoints.push({ y: 100, label: colorHexCode, color: colorHexCode }); } var chart = new CanvasJS.Chart("chartContainer", { animationEnabled: true, colorSet: "customColorSet", theme: "light2", title: { text: "Data Feed" }, axisY: { title: "Height", maximum: 100, lineThickness: 0, tickThickness: 0, gridThickness: 0, stripLines: [{ value: 0, showOnTop: true, color: "gray", thickness: 2 }] }, axisX: { lineThickness: 0, tickThickness: 0, title: "Color Hexadecimal Codes" }, data: [{ type: "stackedColumn", label: "label", indexLabelPlacement: "outside", indexLabelOrientation: "horizontal", dataPoints: dataPoints }] }); chart.render(); function bubbleSort() { var dps = chart.options.data[0].dataPoints; var len = dps.length; for( var inx = 0; inx < len; ++inx ) { for(var jnx = 0; jnx < len - 1 - inx; ++jnx) { if( dps[jnx].color > dps[jnx+1].color ) { var temp = dps[jnx]; dps[jnx] = dps[jnx+1]; dps[jnx+1] = temp; chart.options.data[0].dataPoints = dps; chart.render(); setTimeout(function(){ //do what you need here }, 2000); } } console.log("Iteration " + inx ) } }April 22, 2021 at 6:40 pm #34069It seems like you are not calling bubbleSort method in the code that you have shared. Calling the method seems to be working fine. Please take a look at this JSFiddle.
—
Vishwas R
Team CanvasJSApril 23, 2021 at 2:22 am #34075Hi Vishwas,
The invocation to bubbleSort does sort the chart. But my intention is to have it visualized at every step – at every swap operation. So I dont just want to show the end result, but the interim results as well.
I noticed that this is not happening and I just see the content getting sorted at the end. Hope I am clear now. Please let me know if you need further information.
April 27, 2021 at 6:34 pm #34138You can swap datapoints based on colors using bubble-sort & show it in chart by adding a delay after every iteration. Delay is required as chart gets rendered within few milliseconds along with sorting datapoints. Please find the code-snippet below.
function bubbleSort() {
  var dps = chart.options.data[0].dataPoints;
  var len = dps.length;
  var inx = 0;
  var jnx = 0;

  (function sortEachElement() {
    if(jnx >= len - 1 - inx) {
      jnx = 0;
      inx++;
    }
    if(inx < len) {
      if( dps[jnx].color > dps[jnx+1].color ) {
        var temp = dps[jnx];
        dps[jnx] = dps[jnx+1];
        dps[jnx+1] = temp;
        for(var i=0; i<dps.length; i++) {
          dps[i].x = undefined;
        }
        chart.options.data[0].dataPoints = dps;
        chart.render();

      }

      jnx++;
      setTimeout(function (){
        sortEachElement();
      }, 10);
    }
  })();
}
Please take a look at this JSFiddle for complete code.
—
Vishwas R
Team CanvasJS
Tagged: dynamic chart
You must be logged in to reply to this topic.