@nicolapresa,
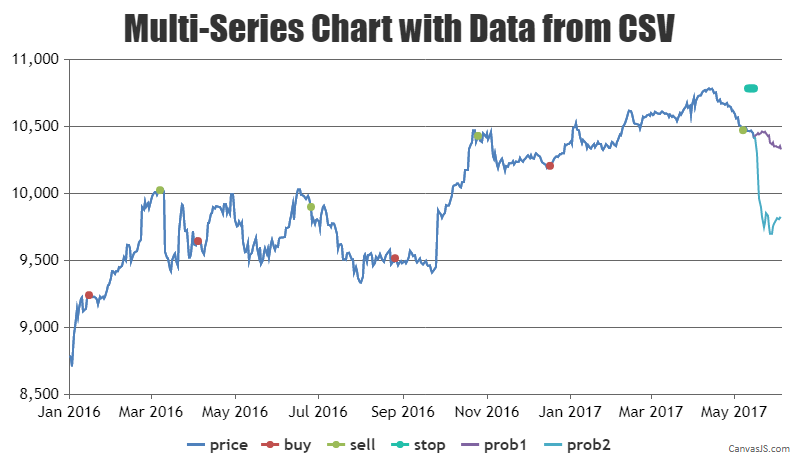
Yes, it’s possible to create a multi-series chart with data from a CSV file. You can get the CSV data using AJAX call and parse the same to the format accepted by CanvasJS.
Here is the code snippet for the same,
  for(var j = 0; j < noOfSeries; j++)
    chart.options.data.push({ type: "line", showInLegend: true, dataPoints: [] });

  for (var i = 1; i < csvLines.length; i++) {
    if (csvLines[i].length > 0) {
      points = csvLines[i].split(";");
      dateTime = points[0].split(".");
      dateTime = dateTime[2] - 1 + "-" + dateTime[1] + "-" + dateTime [0];

      for(var j = 1; j < points.length; j++) {
        chart.options.data[j-1].dataPoints.push({x: new Date(dateTime), y: points[j] === "" ? null : Number(points[j])});
      }
    }
  }
Kindly take a look at this JSFiddle for an example on creating multi-series chart with the data from CSV.
Considering this thread as duplicate of chart from csv multiple lines. Hence closing the same.
—
Adithya Menon
Team CanvasJS
.