Home Forums Chart Support Chart compressed when add more chart lines

Chart compressed when add more chart lines

Viewing 3 posts - 1 through 3 (of 3 total)
  • #36737

    Hi,

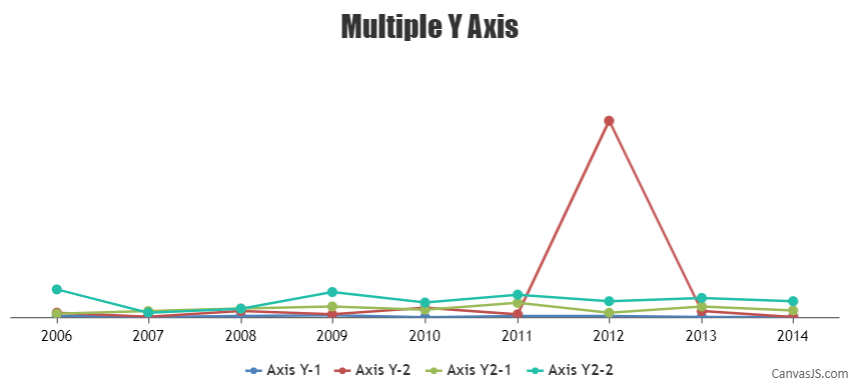
    I have a chart with multiple y-axis. I will add multiple lines dynamically. When I try to add a new line the chart add some padding on the left side so the end results in the chart have some empty space on the left side.

    I have sample jsfiddle. How can I remove that padding/margin when add new line. Why it’s happening? What am I missing here?

    #36751

    @ragu1991nathan,

    By default, axis reserves some space around it which can be removed by setting margin: -5. You can also achieve the same by returning an empty string in labelFormatter as shown below –

    labelFormatter: function(e) {
         return "";
    }

    Please take a look at this updated JSFiddle for a working example with complete code.

    Removing padding from axis

    ___________
    Indranil Singh Deo
    Team CanvasJS

    #36754

    Thank you so much. It’s working as expected.

Viewing 3 posts - 1 through 3 (of 3 total)

You must be logged in to reply to this topic.