Sivaranjani
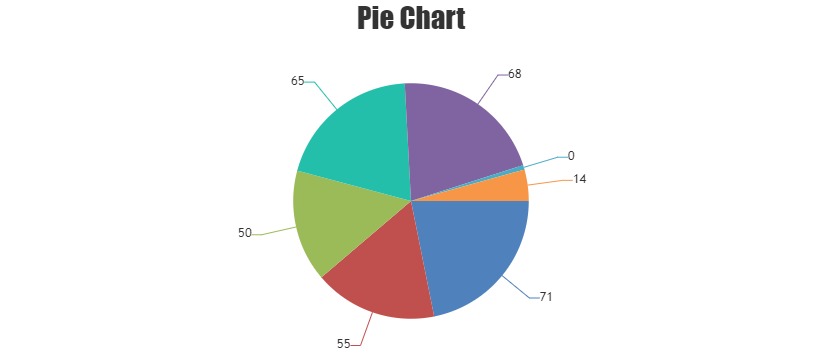
It’s not possible to show slice with a minimum space in pie-chart when the datapoint value is 0. However you can either show indexlabel to the section or add a defined value as minimum value to it as shown in below code-snippet.
function setMinValue() {
  var data = chart.options.data;
  for(var i = 0; i < data.length; i++) {
    for(var j = 0; j < data[i].dataPoints.length; j++) {
      var yValue = data[i].dataPoints[j].y;

      if(yValue <= minValue && yValue >= -minValue) {
        data[i].dataPoints[j].y = yValue < 0 ? yValue : minValue;
        data[i].dataPoints[j].toolTipContent = yValue.toString();
        data[i].dataPoints[j].indexLabel = yValue.toString();
      }
    }
  }
}
Please take a look at this JSFiddle for complete code.
.