Home Forums Report Bugs Bugs when use Synchronized Charts

Bugs when use Synchronized Charts

Viewing 5 posts - 1 through 5 (of 5 total)
  • #33423

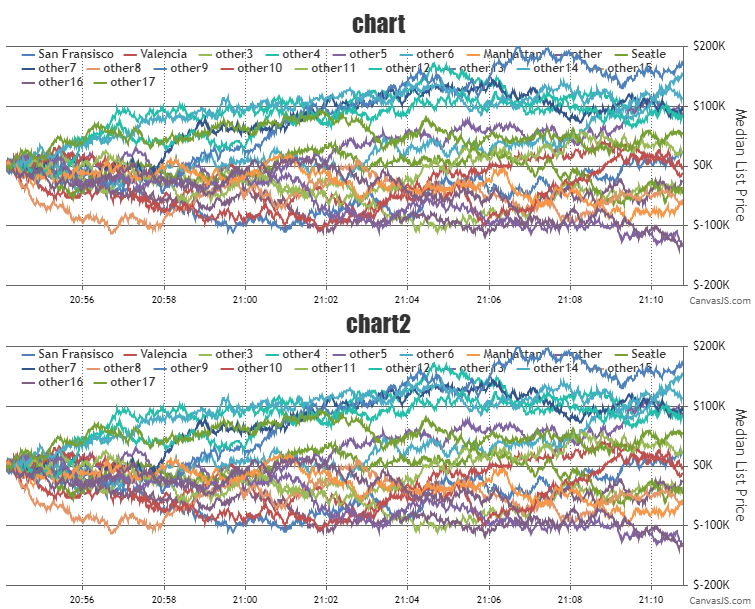
    Hi there, I found something weird insynchronized charts, I found 2 bugs(?):

    1 – Panning/Zooming + Reset Option shows when try to hide some series.
    Steps to reproduce:
    1 -> Zoom in chart
    2 -> Reset Zoom
    3 -> Hide some series

    2 – Panning/Zooming + Reset Option shows when resize window.
    Steps to reproduce:
    1 -> Zoom in chart
    2 -> Reset Zoom
    3 -> Resize window
    In my case this second bug always happen when resize, but in demo only happen if i do the 3 steps.

    I let you the demo but actually you can see same bugs in your CanvasJS demo

    #33495

    @nerviozzo96,

    It seems to be happening due to programmatically zooming and resetting the charts. We will look into it further. However, you can hide toolbar on resizing the window or on hiding dataSeries by adding below function toggleToolBarDisplay which displays and hides the toolbar. The function toggleToolBarDisplay hides the toolbar whenever chart is in reset state.

    function toggleToolBarDisplay() {
      var toolBar = document.getElementsByClassName("canvasjs-chart-toolbar");
      for(var i=0; i<toolBar.length; i++) {
        toolBar[i].style.display = resetFlag ? "none" : "block";
      }
    }

    Also, Please take a look at this JSFiddle for complete code.

    Syncing Zoom & Pan across Multiple Charts

    —-
    Manoj Mohan
    Team CanvasJS

    #33611

    Thanks! If you progress in this, let me know, in the meantime I will use this solution.

    #34412

    Hello, im having a little problem with this.
    I want to have 2 charts with different values (that mean different maximums) with same width or margin.
    jsfiddle
    I let you an image to clarify what I mean AxisY different width example

    #34447

    @nerviozzo96,

    You can align y-axis across multiple charts by setting the margin property. The margin value has to be calculated based on the bounds of y-axis as shown in the code below –

    var axisYBoundMax = 0;
    for (var i=0; i<charts.length; i++) {
      axisYBoundMax = Math.max(axisYBoundMax, charts[i].axisY[0].bounds.x2);
    }
    
    for(var i = 0; i < charts.length; i++) {
      charts[i].axisY[0].set("margin", axisYBoundMax - (charts[i].axisY[0].bounds.x2 - charts[i].axisY[0].bounds.x1));
    } 

    Please take a look at this JSFiddle for complete working code.

    Align Y-axis across Multiple Charts

    —-
    Manoj Mohan
    Team CanvasJS

Viewing 5 posts - 1 through 5 (of 5 total)

You must be logged in to reply to this topic.