Home Forums Chart Support Bubble chart with text labels

Bubble chart with text labels

Viewing 2 posts - 1 through 2 (of 2 total)
  • #34347

    Dear all

    i want to draw a bubble chart where
    the x-axis data is label such as: ‘test1’, ‘test2’, ‘test3’
    the y-axis and z-axis data are numbers.
    As i figured out, it is impossible.
    Can anybody please guide me on how to draw such a chart.
    Regards

    #34359

    @ijustloveit13,

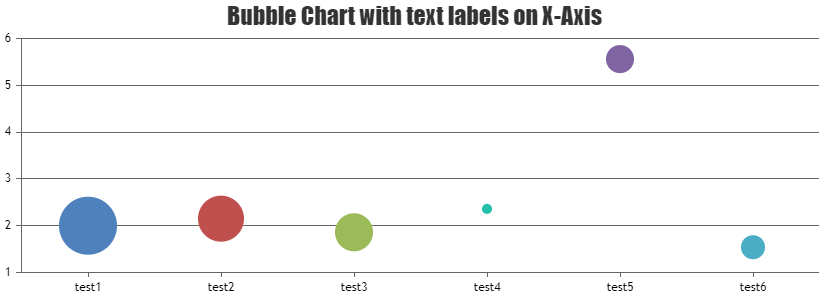
    You can pass label in dataPoints to display text in x-axis labels like ‘test1’, ‘test2’, etc. in the above case. Please check out this code snippet for the same.

    .
    .
    dataPoints: [
       { label: "test1", y: 2.00, z:306.77 },
       { label: "test2", y: 2.15, z: 237.414 },
       { label: "test3", y: 1.86, z: 193.24 },
       { label: "test4", y: 2.36, z: 112.24 },
       { label: "test5", y: 5.56, z: 154.48 },
       { label: "test6", y: 1.54, z:141.91 }
    ]}
    .
    .
    

    Also, kindly take a look at this JSFiddle for complete working code.

    Bubble Chart with text labels on X-Axis

    —-
    Manoj Mohan
    Team CanvasJS

Viewing 2 posts - 1 through 2 (of 2 total)

You must be logged in to reply to this topic.