Home Forums Chart Support bubble chart stroke / pin y axis

bubble chart stroke / pin y axis

Viewing 6 posts - 1 through 6 (of 6 total)
  • #37216

    Hello,
    I have two questions to ask, sorry if these questions have already been asked.

    1) I wonder if there is a way to set stroke color on the bubble of the bubble chart.

    2) Is it possible to pin(freeze) the y-axis when the chart is horizontally long which requires scrolling?

    Thank you in advance!

    #37239

    @tiapoo,

    1) I wonder if there is a way to set stroke color on the bubble of the bubble chart.

    You can set markerBorderThickness and markerBorderColor to draw a border around the bubbles in a bubble chart.

    2) Is it possible to pin(freeze) the y-axis when the chart is horizontally long which requires scrolling?

    We are looking into this further & we will get back to you at the earliest.


    Thangaraj Raman
    Team CanvasJS

    #37241

    @ThangarajRaman

    Ah, thank you for your reply. Didn’t know that different terms are used for the stroke color.
    Will wait for the update, thank you!

    • This reply was modified 2 years, 10 months ago by tiapoo.
    #37244

    @tiapoo,

    2) Is it possible to pin(freeze) the y-axis when the chart is horizontally long which requires scrolling?

    Please take a look at this JSFiddle for an example on freezing the y-axis and scrolling the chart horizontally along x-axis using jQuery-UI Slider.

    If this doesn’t fulfill your requirement, could you please create a JSFiddle with your use-case and share it with us so that we can understand the scenario better and help you out?


    Thangaraj Raman
    Team CanvasJS

    #37326

    Hi, thank you so much for the previous help.
    I have one more question.

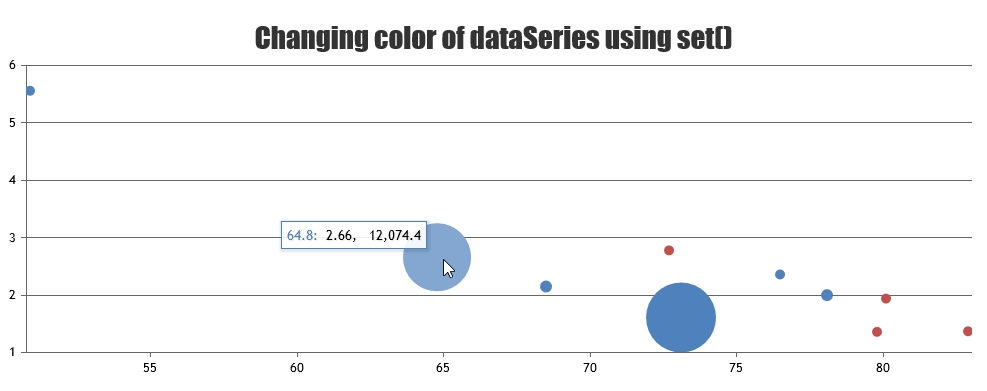
    I have a bubble chart with multiple categorizations, and each category has different-colored bubbles. It looks something like this:
    http://jsfiddle.net/canvasjs/snvwsjoo/

    Here, how can I assign different colors on each category’s toolTip? For instance, I want the blue bubble to have a blue borderColor, and the red bubble to have a red borderColor.

    Cheers!

    #37349

    @tiapoo,

    Tooltip accepts the color of datapoint as it’s border-color by default & it seems to be working fine. Please refer to the screenshot below.
    Chart Tooltip Border Color

    If you are still facing issue, can you kindly create JSFiddle & share it with us so that we can look into the code / chart-options being used, understand the scenario better and help you out?


    Thangaraj Raman
    Team CanvasJS

Viewing 6 posts - 1 through 6 (of 6 total)

You must be logged in to reply to this topic.